Download
1 / 13
130 likes | 268 Views
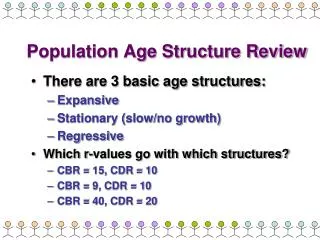
POPULATION AGE STRUCTURE. SECTION 10-2. What is age structure?. Age structure – the distribution of males and females in each age group Diagram made by demographers Plot the % or #s of males & females in each of 3 age categories 3 Age Categories Prereproductive = Ages 0-14

E N D
POPULATION AGE STRUCTURE SECTION 10-2
What is age structure? • Age structure – the distribution of males and females in each age group • Diagram made by demographers • Plot the % or #s of males & females in each of 3 age categories • 3 Age Categories • Prereproductive = Ages 0-14 • Reproductive = Ages 15-44 • Postreproductive = Ages 45+
Population Histograms • The following slide shows constructed Population Histograms • Notice their structure • In creating these histograms, one starts from the center line, and draws the “bar” out from that line • Male data is to the left of the center line • Female data is to the right of the center line
Major factor that determines population growth? • # of people under age 15! • WHY????? • Because a large number of females are moving into their reproductive years • The birth rate will increase (unless the death rates rise sharply) Tweens tEENAGERS
Population Histograms • The next slide shows population histograms from France and India • Notice how, in India, tweens / teenagers are the biggest groups on that histogram! (Approx 5.5 – 6% of the population) • The same is true in France! While not the largest group, teenagers make up approximately 4 % of the population • (The only group that’s larger than teenagers are the 30-somethings!)
Boom or Bust? • Population booms & busts both cause problems • Baby boom population • After WWII (1946-1964) • Addition of 79 million people to the population • Baby bust • Between 1965-1976 • When the Total Fertility Rate (TFR) decreased dramatically (people were having less children)
Population booms & busts both cause problems • Problems with declining population • Baby boom generation is retiring: • Smaller workforce (shortage of workers) • Not enough money from taxes to support boomers (baby bust generation will suffer…will have higher income, healthcare, Social Security taxes) • Trouble funding pensions • Increase retirement age, raise taxes, etc
Population booms & busts both cause problems • At the same time…baby bust group has an easier time (than baby boomers): • Less people competing for education opportunities, jobs and services • Wages are higher due to labor shortages • Many baby bust group members may find it difficult to get job promotions when they hit middle age because: • Baby boomers will be upper level management • Baby boomers may delay retirement (if they’re in good health) or need to accumulate more funds for retirement
Who comes after the baby bust generation? • The echo-boom generation • Individuals born since 1977 • These predictions (baby boomers / busters) tell us that ANY booms or busts in the age structure of a population will create social & economic changes that can cause problems throughout a society for decades
Effects of Rapid Population Decline • Ex: Increase in death rate due to AIDS • Globally between 2000 and 2050, AIDS is projected to cause the premature deaths of 278 million people in 53 countries – 38 of them Africa. These premature deaths are almost equal to the entire current population of the United States.
AIDS TRAGEDY • Harmful effects • Drop in life expectancy • Loss of productive workforce • Loss of trained professionals • Increase in # of orphans • What can be done? • Reduce spread of HIV through education & health care • Financial assistance to pay for the workers • Is this our responsibility?