Download
1 / 20
210 likes | 485 Views
Population Theories Population structure and aging. Age and sex composition Proportion of males and females in each age group. Age (and sex) composition strongly influences demographic patterns (births, deaths, migrations, marriages). Demographic behaviours influence

E N D
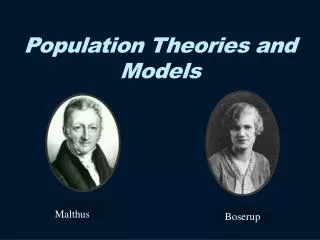
Population Theories Population structure and aging
Age and sex composition Proportion of males and females in each age group Age (and sex) composition strongly influences demographic patterns (births, deaths, migrations, marriages) Demographic behaviours influence the age structure of a population • Age and sex composition has considerable impact on social, economic, health, and political processes, both present and future. • For example, different age-sex compositions result in different proportions of the population in the labour force or in school, as well as having different medical needs, social investment patterns, etc.
Population pyramids Age pyramid is a special type of bar graph. Male and female populations are plotted on opposite sides (usually males on the left and females on the right). We can use the total number of cases (for age and sex) or the relative distribution (number of cases / total population size for both sexes) in each group. NOTE that we ALWAYS consider age in completed years.
Age pyramids may help to: a. detect data gathering errors (census, surveys, etc.) b. analyze the demographic history of a population (at least for the last 100 years). Age pyramids Data required for the age pyramid
Age pyramids Morocco. Census 1960 a. Errors . High illiteracy they do not use a calendar the age is know only approximately Ages are rounded. Other possible errors: - underestimation of not-married women (young women, widowed or divorced women); - ages are inflated at the older ages in population that do not use calendar; - underestimation of year zero (the declared age of newborns is 1 even if they are still living their first year of life); - systematic exclusion of armed force members.
Age pyramids Year of birth Age Year of birth higher mortality for males at the old ages (especially among who experienced II WW) b. Traces of history Russia. Source: Goscomstat. 1997 drop in fertility during the wars. drop in births during the repression of landowner farmers (kulaki, 1928-1932) cyclic effects relating to the drop in births (end of ‘60). pro-natalist family policies (’80) drop in births after the fall of the Wall (1989)
Age pyramids b. Traces of history (continued) Romania. Source: ONU 1995 Year of birth Age Year of birth changes due to wars (drop in fertility) and cyclic effects abortion restriction in 1966 (a similar phenomenon occurred in 1987 during the Ceausescu’s regime)
b. Traces of history (continued) Cina. Census 1990 Year of birth Age Year of birth Great Leap Forward (1957-58): strong mortality increase and drop in fertility.
Age pyramids Traces of history: the role of fertility and mortality. India 1951 high mortality e high fertility (medium growth) Kenya 1969high mortality and very high fertility (rapid growth) France 1911 stabilized low fertility (slow growth) Italy 1995drop in fertility Sweden 1950baby boom in the years after the II WW.
Age pyramids Traces of history: the role of international migrations Italy 1911 young adult out-migration (both sexes) Algeria 1974 out-migration (especially men) Kuwait very high young-adult males immigration 1911
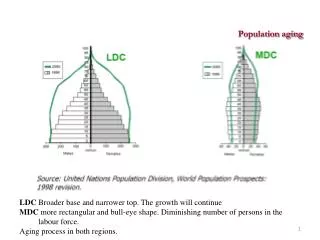
Age pyramids Milano, 2003 Lombardia, 2003 Comparing different situations Etiopia Classic shape: broad base rapidly tapering to the top. Italy Bull-eye shaped with a very thin base (aging population).
Age pyramids Oddities and borderline cases Toulouse (France) heavy bulges in the young adult population (immigration of students) Fiuminata(Mc - Italy) little town in the Appennins; aged population (out-migration of young couples) Sun city (Arizona) heavy bulges in the old ages (immigration of retired people)
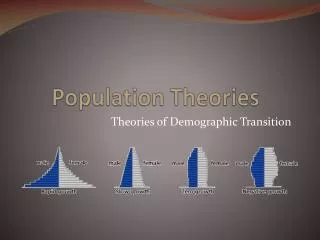
Age pyramids The progression from a Young to an Old age structure Each year a new cohort is born and added to the bottom of the pyramid, while the older cohorts move up as they age. Pyramid Animation Example (Canada 1971 to 2056) 1971 Young age structure (baby boom during ’50 and then a quick drop in fertility) 1980-2000 high proportion of working population (demographic dividend or window of opportunity). Rapid labour force growth and economic development. 2000-2020 rapid aging 2020-2056 aged population (very high proportion of people aged 65+)
China: 1980-2000 demographic dividend. High proportion of people aged 30-39 (prime ages for economic productivity) 2000-2025 bulge will have moved into the middle ages (less productivity but high consumption) 2025- onward: aging population ( important policy issues) Age pyramids of the world: http://www.census.gov/ipc/www/idb/
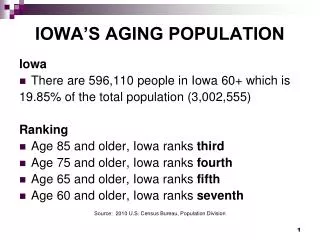
Aging Population aging: Relative increase in proportion of people in the older age groups Aging is a totally new social phenomenon. It is the result of two important attainments of the humanity: the reduction of mortality and the birth control. How can we measure the aging process? Firstly, we can consider the proportion of some big age group: young people(0-14 years of age), adults (working age) (15-65 years of age), old people (65+ years of age) .
Population aging In the world, the number people under 25 will reach its peak around 2030. However, during the XXI century all the regions of the world will experience aging WORLDtoday at the end of XXI century % 60 and over 10% between 24 and 44% % 80 and over 1% 4-20% - Western Europe (up to 43%)
Population aging Incidence of people aged 65+. Geographical distribution. Year 2003.
Population aging Incidence of people aged -14. Geographical distribution. Year 2003.
Population aging Differences between rich and poor countries. Year 2003 <15 years 65+ years Subsaharian Africa 44% 3% Europe 17% 15%
Population aging MDC: the overtaking occurred in the ’90 LDC: the overtaking will occur in the future