Download
1 / 23
240 likes | 270 Views
POPULATION STRUCTURE. OBJECTIVES At the end of this lesson you should be able to…. Interpret population pyramids for MDCs and LDCs Calculate dependency ratios Discuss the implications of dependency ratios Examine case studies of countries exhibiting ageing and youthful populations.

E N D
OBJECTIVESAt the end of this lesson you should be able to… • Interpret population pyramids for MDCs and LDCs • Calculate dependency ratios • Discuss the implications of dependency ratios • Examine case studies of countries exhibiting ageing and youthful populations
POPULATION STRUCTURES • The rates of natural increase, births, deaths, infant mortality and life expectancy all affect the population structure of a country. • The population structure of a country can be shown by a populationor age-sex pyramid.
What is a population pyramid? • It is a diagram that gives information about the proportion of males and females in each age group. • Also shows: - proportion of young people (0 -14 ) - proportion of working people (15 – 59) - proportion of elderly people (60+)
What is a population pyramid? Vertical Axis - Age Groups Elderly dependents Working population Young dependents Horizontal Axis – Percentage / number
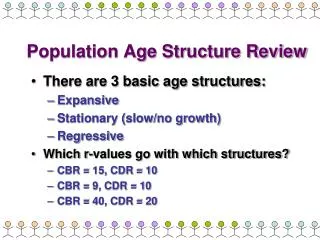
TYPES OF POPULATION PYRAMID • While all countries' population pyramids differ, three types have been identified by the fertility and mortality rates of a country • Expansive pyramid - A population pyramid showing a broad base, indicating a high proportion of children, a rapid rate of population growth, and a low proportion of older people. This type of pyramid indicates a population in which there is a high birth rate, a high death rate and a short life expectancy. E.g. Kenya, India • Stationary pyramid - A population pyramid typical of countries with low fertility and low mortality. E.g. Argentina • Contractive pyramid - A population pyramid showing lower numbers or percentages of younger people. The country will have a greying population which means that people are generally older. E.g. Sweden • They can also be related to the DTM
INTERPRETING POPULATION PYRAMIDS When explaining /describing / interpret / comparing population pyramids try to comment on the following : • Shape • Birth Rate • Death Rate • Infant mortality • Life expectancy • % of dependants to economically active (Young dependants =0-15 / elderly = 65+) • Migration (If there are any sudden bulges this is usually due to in-migration, if there are bites inwards usually because of out-migration)
Population Population structure A B Population pyramids can tell us important facts about the structure of the population of that country. The population structure is the amount of people in each of the main age groups – NOT the shape of the pyramid, but this can give us clues about the structure. It can also tell us about the birth rate, death rate and life expectancy. The main age groups you need to mention are the young dependants (0-15s), the economically active (16-64) the older dependants (65+).
Population Population structure B A 1. The birth rate – this is shown by the width of the base. The wider the base of the pyramid the higher the birth rate. 2. The death rate – this is shown by the sides of the pyramid. The more sloping it is the higher the death rate as there are less people in each successive age group. 3. The life expectancy – this is shown by the how high the pyramid reaches and how many people have survived into old age.
Population Population structure LDCs Pyramid A, a developing country (LDC) has this shape of pyramid because: A It has a wide baseindicates high proportion of young dependents. This is due to high Birth Rates caused by large family traditions, limited access to and knowledge of family planning, the need for children for labour. The pyramid narrows quickly due to high infant mortality rates and young dependents not surviving into economically active due to problems of healthcare access, food supplies and dirty water. The pyramid tapers rapidly towards the top indicating a low percentage of elderly dependents. This is due to high, but falling, Death Rates and low life expectancy as a result of poor healthcare, inadequate welfare systems, overcrowding, malnutrition.
Population Population structure MDCs Pyramid B, a developed country (EMDC) has this shape of pyramid because: B · Narrow base indicates lower percentage of young dependents (bullet-shaped) due tolow / falling Birth Rates as a result of increased use ofcontraception, more women pursuing careers, increasinglymaterial lifestyles etc. High percentage ofeconomically activegivesuniform structure. This is due tolow mortality ratesin theyoung dependentpopulation- most children/teenagerssurviveto adulthood due toaccessibleand widespread healthcare,reliablefood supplies etc. Reasonablywide topshowslarge proportion of elderly dependents. This is due to a decline in Death rates/increase in life expectancy as a result of advances in geriatric health and community care, state and private pensions raising living standards, specialised housing, improved diets etc.
DEPENDENCY RATIOS The population of a country can be divided into two categories according to their contribution to economic productivity. Those aged 15-65 years are known as the economically active or working population; those under 15 (the youth dependency ratio) and over 65 (the old age dependency ratio) are known as the non-economically active population.
DEPENDENCY RATIOS • Information on the percentage of people in different age groups can be used to calculate the dependency ratio of a population • This is the size of the ‘dependent’ population as a proportion of those who are ‘economically active’. i.e. Those in the work force or who are of working age. • It can be expressed as: children (0-14) and elderly (65 and over)x 100 those of working age For example, in the UK, 1980, the dependency ratio was 55. This means that for every 100 people of working age in 1980, there were 55 dependents upon them.
IMPLICATIONS OF DEPENDENCY RATIO ‘YOUTHFUL POPULATION’ • Generally a population pyramid that displays a population percentage of ages 1–14 over 30% and ages 75 and above under 6% is considered a "young population" (generally occurring in developing countries, with a high agricultural workforce). LARGE YOUTHFUL POPULATION: • more spent on education facilities • more strain on the working class • education of public on family planning and birth control • more spent on early child care centres
IMPLICATIONS OF DEPENDENCY RATIO ‘AGING POPULATION’ • A population pyramid that displays a population percentage of ages 1–14 under 30% and ages 75 and above over 6% is considered an "aging population" (that of which generally occurs in developed countries with adequate health services, e.g. Australia) AGED POPULATION: • more medical facilities • adaptation of transport • more strain on the working class • younger population can learn from the present aged population
When examining the implications of a “youthful” or “aging” populations, one must consider the following: • Social( Things that concern people) • Economic (Things that affect money) • Political (Things that affect governments or local councils etc) • Any advantages?