Download
1 / 22
250 likes | 595 Views
Manuel Pondeca, Geoff Manikin , David Parrish, James Purser, Geoff DiMego, Stan Benjamin, John Horel, Lee Anderson, Brad Colman, Greg Mann, and Greg Mandt Mesoscale Modeling Branch National Centers for Environmental Prediction Manuel.Pondeca@noaa.gov 301-763-8000 ext 7734

E N D
Manuel Pondeca, Geoff Manikin , David Parrish, James Purser, Geoff DiMego, Stan Benjamin, John Horel, Lee Anderson, Brad Colman, Greg Mann, and Greg Mandt Mesoscale Modeling Branch National Centers for Environmental Prediction Manuel.Pondeca@noaa.gov 301-763-8000 ext 7734 NOAA Science Center-Room 207 5200 Auth Road Camp Springs, MD 20746-4304 THE NCEP REAL-TIME MESOSCALE ANALYSIS (RTMA)
Topics • The need for an Analysis of Record (AOR) and the Proposed Three Phase Implementation Plan • The Real-Time Mesoscale Analysis (RTMA): Phase-I of the AOR • The Mechanics of the RTMA • GSI-2DVar • Precipitation fields • Sky cover fields • Current and Future Work
Analysis of Record A comprehensive set of the best possible analyses of the atmosphere at high spatial and temporal resolution with particular attention placed on weather and climate conditions near the surface Critical need for AOR at NOAA NWS!
Analysis of Record (AOR)Summary of Need • In part needed to: • Meet the NDFD production requirement --a minimum analysis with a grid spacing of 5-km and temporal frequency of one hour. • Provide analyses to verify NDFD gridded forecasts • Enhance Mesoscale Modeling efforts • Establish a benchmark climate analysis for use in regional and local climate change studies • Enhance Representativeness of Physical Driving in Dispersion modeling (eg. for transport of hazardous materials). • Enhance Aviation and sfc transportation management efforts • Enhance Coastal zone and fire management efforts
August 2004: Mesoscale Analysis Committee (MAC) established by Director, NWS Office of Science and Technology to implement AOR program. MULTI-PHASE APPROACH ADOPTED: Phase I – Real-time Mesoscale Analysis Analyses produced hourly within 30 minutes. Time constraint is a factor. Prototype for AOR. Phase II – Analysis of Record Use state-of-the-art methods to obtain best analysis possible Time constraint lifted Phase III – Reanalysis Apply mature AOR retrospectively 30 year time history of AORs AOR: Three Phase Program
Real-Time Mesoscale Analysis (RTMA) • Fast-track, proof-of-concept of the AOR program. Intended to: • Enhance existing analysis capabilities and generate near real-time hourly NDFD grid matching analysis of surface parameters and clouds. • Also provide estimates of analysis uncertainty • Establish benchmark for future AOR efforts • Developed by NCEP and ESRL • Running since August 2006 for CONUS. Extended to Alaska in 2007, and to Hawaii and Puerto Rico in 2008.
CONUS RTMA PROCEDURE RUC 13 Downscaled to 5km NDFD grid Stage-II Precip Interpolated to 5km NDFD grid NDFD terrain Observations Sky Cover First guess 2m-T, 2m-q, 10m-u and v, psfc OUTPUT in GRIB2 FILE 1: 2m T, q 10m u, v, psfc FILE 2: Precip FILE 3: Sky Cover GSI 2DVar AWIPS FTP Server RTMA Website Analysis Uncertainty
Summary of the Conus RTMA • GSI-2DVar analysis of near surface parameters: Currently, T and SPH at 2m, wind at 10m, and surface pressure. • Hourly 5km resolution analysis • First guess: One hour 13km RUC forecast downscaled to NDFD grid • Univariate analysis • Terrain following background error covariances • Estimate of analysis error/uncertainty • Precipitation – NCEP Stage II analysis • Sky cover – NESDIS GOES sounder effective cloud amount
RTMA First Guess / 2m T Original 13 km Downscaled 5 km
RTMA First Guess / 10m Wind Original 13 km Downscaled 5 km
Observations and Quality Control • Surface Land (SYNOPTIC and METAR) • Surface marine (Ship, Buoy, C-MAN, Tide Gauge) • Splash-level dropsonde over ocean • Surface Mesonets • SSM/I Superobed wind speed over ocean • QUICKSCAT winds over ocean DATA FEED • Conventional through TOC • Mesonets through MADIS. In Future Also Through MesoWest
Observations and Quality Control PRE- GSI QC: • MADIS QC control flags honored • GSD Mesonet Wind “Provider-Uselist” • GSD Mesonet Wind “Station-Uselist” • Rejectlists from WFOs • Dynamic Rejectlists QC Within GSI: • Gross-error Check Mesonet Issues: Mesonets comprise majority of obs but they are not as ``good’’ as the other conventional surface ob sources.
SURFACE TEMPERATURE OBSERVATIONSTotal = 11911 ; METARS = 1678 (14. 1%) MESONETS = 9914 (83.2%) Others = 319 (2.6%) Cycle 2008081517
Anisotropic Background Error Covariance Functions • Background error covariances mapped to smoothed version of the NDFD topography => Restrict ob influence based on elevation differences. • Implementation is based on the use of Recursive filters in grid-point space. Covariance model is a variant of the Riishojgaard model (1998, Tellus, V50A, 42-57) For details, see: • Purser, Wu, Parrish and Roberts, 2003, MWR, Vol 131, p1524-1535 • Purser, Wu, Parrish and Roberts, 2003, MWR, Vol 131, p1536-1548
Error Correlations for Valley Ob (SLC) Location Plotted Over Utah Topography Isotropic Correlation: obs' influence extends up mountain slope Anisotropic Correlation: obs' influence restricted to areas of similar elevation
RTMA Analysis Uncertainty • METHOD USED TO ESTIMATE THE ANALYSIS ERROR IS ADAPATION TO THE GSI OF THE LANCZOS METHOD DESCRIBED BY FISHER AND COURTIER (1995, Tech. Memorandum 220, ECMWF). • ANALYSIS ERROR COVARIANCE MATRIX=INVERSE OF HESSIAN MATRIX IN INCREMENTAL VARIATIONAL ANALYSIS. • USE BI-PRODUCTS OF THE CONJUGATE-GRADIENT ALGORITHM OF THE GSI (gradient vectors and stepsizes) TO COMPUTE SUBSET OF EIGENVECTORS AND EIGENVALUES OF HESSIAN AND RECONSTRUCT LOWER-RANK REPRESENTATION OF THIS MATRIX (OR OF ITS) INVERSE.
TEMP INCREMENTS + ANALYSIS ERROR FOR 14Z 22 FEB 2008 ANAL INCREMENTS ANAL ERROR
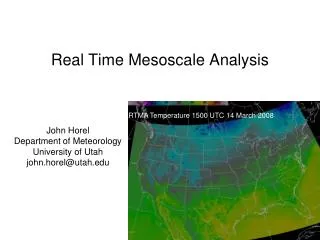
Temperature Analysis for 12 Z 6 Oct 2008 http://www.emc.ncep.noaa.gov/mmb/rtma/para
NCEP RTMA Precipitation Analysis • NCEP Stage II (real-time) and Stage IV (delayed) precipitation analyses are produced on the 4-km Hydrologic Rainfall Analysis Project grid • The existing multi-sensor (gauge and radar) Stage II precipitation analysis available 35 minutes past the hour • RTMA is mapped to the 5 km NDFD grid and converted to GRIB2 • Upgrade plan including OHD analysis + improved gauge QC from FSL • Primary contact: Ying Lin, NCEP/EMC • http://wwwt.emc.ncep.noaa.gov/mmb/ylin/pcpanl/ ORIGINAL NDFD GRIB2
Sky Cover: Effective Cloud Amount (a) • Effective Cloud Amount (ECA, %) • Derived from GOES sounder • Mapped onto 5-km NDFD grid • Converted to GRIB2 for NDGD • Contact: Robert Aune, Advanced Satellite Products Branch, NESDIS (Madison, WI) GOES-12 IR image (11um) (b) (c) ECA from GRIB2 file – 5km grid Derived ECA from GOES-12
EXPAND NUMBER OF ANALYZED PARAMETERS: ADD CLOUD BASE, VISIBILITY AT 2m, WIND GUST AT 10m, PBL HEIGHT, etc. TURN ON BIAS CORRECTION FOR FIRST-GUESS IMPROVE FIRST GUESS, eg. HURRICANE TREATMENT TURN ON VARIATIONAL QC for Obs RUN RTMA CONUS AT 2.5km RESOLUTION EXPAND BAKCGROUND ERROR COVARIANCE SHAPES FUTURE PLANS