Download
1 / 15
220 likes | 818 Views
Real-time PCR Analysis. What is Real-time PCR?. Allows us to make copies ( amplify ) pieces of DNA Produces quantitative results Why are quantitative results useful?

E N D
What is Real-time PCR? • Allows us to make copies (amplify) pieces of DNA • Produces quantitative results • Why are quantitative results useful? • Knowing the amount of viral DNA found in a patient sample is an indicator of how recently the patient was infected, and the degree to which the virus has been able to replicate in the victim.
Equipment • Real-Time PCR is identical to a traditional PCR except that the progress of the reaction is monitored by a camera or detector in “real-time”. Thermocycler attached to computer Thermocycler
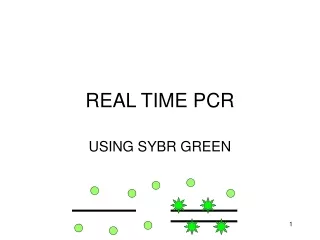
Monitoring PCR • There are a number of techniques that are used to allow the progress of a PCR to be monitored. Each technique uses some kind of fluorescent marker which binds to the DNA. • Hence as the number of gene copies increases during the reaction so the fluorescence increases. This allows the efficiency AND rate of the reaction to be seen. • These dyes fluoresce only when bound to double-stranded DNA. So as the number of copies of DNA increases during the reaction so the fluorescence increases.
Reading PCR Results • The output from a real-time PCR reaction is in the form of a graph showing the number of PCR cycles (1 cycle = 94°C, 52°C, 72°C) against the increasing fluorescence. This is known as an amplification plot. • The horizontal line on the graph represents a “threshold” set by the user. The point at which the amplification plot crosses this threshold is known as the Ct (critical threshold) value.
Review • Why is real-time PCR useful? • What machine is used to conduct a PCR reaction? • What do the x and y axes on a PCR results graph represent? • What is a critical threshold?
Chart Basics • During real-time PCR, charts are produced with the graphs. The chart displays four items: 1. The color legend for each sample as reported in the graph, 2. The well in which the microtube was placed in the thermocycler, 3. The contents of each microtube, 4. The cycle at which DNA amplification passes the critical threshold. If DNA was NOT amplified, no value will be reported in the “Ct” column of the chart.
A Simple Example • In this example, PCR analysis was done on two samples. Sample 1 passes the critical threshold in 12 cycles (Sample 1 Ct = 12). Since the sample passed the critical threshold, we know that DNA was amplified in Sample 1. • In contrast, Sample 2 did not pass the critical threshold. There was no reported value in the Ct column for Sample 2. Therefore, DNA was NOT amplified in Sample 2.
Review • Which patient DNA was amplified? • How do you know? • Do you use the chart or the graph to find your answer? Patient B Patient A
Positive and Negative Controls How do you know that your PCR result is accurate? There are a number of variables that can adversely affect your PCR results. • Could you have just amplified a contaminant (your own DNA)? • Were all of your reagents working? • Did you forget to add nucleotides? • Were your reagents contaminated? The ONLY way to know that your result is accurate (whether positive or negative) is by using controls.
Master Mix • To make the process of setting up a PCR reaction easier to actually do, lab technicians will often prepare a “master mix” which contains all of the following ingredients: • Free nucleotides (dNTPs): raw material of DNA (A,T,C,G) • DNApolymerase (Taq polymerase): enzyme that assembles the nucleotides into a new DNA chain • Primers: pieces of DNA complementary to the template that tell DNA polymerase exactly where to start • Flourescent dye: “lights up” when it binds to complete DNA strands
Positive Control • Recipe: • Master Mix + DNA from the virus you are trying to detect. • Results: • We expect for positive controls to provide a positive signal. • If positive controls do not provide a positive signal (DNA is not amplified in the PCR reaction), then something probably went wrong with the reaction. • E.g. Reagents may be bad, you might have forgotten to add an ingredient, etc.
Negative Control • Recipe: • Master Mix + water. • Results: • We expect for negative controls to provide NO signal (there should be no DNA present in the reaction so nothing can be amplified). • If negative controls provide a positive signal (DNA is amplified in the PCR reaction), then something is probably contaminating the reaction • E.g. from your hands? the air? within reagents? etc.
Another Example Positive Control Patient Negative Control
References • Beginner’s Guide to Real-time PCR: http://www.primerdesign.co.uk/Download%20material/Beginners%20guide%20to%20real-time%20PCR.pdf • http://pathmicro.med.sc.edu/pcr/realtime-home.htm