Download
1 / 40
430 likes | 459 Views
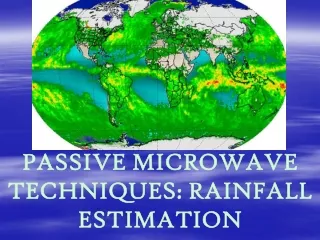
RAINFALL ESTIMATION FROM SATELLITE OBSERVATIONS. All liquid or solid phase aqueous particles that originate in the atmosphere and fall to the earth's surface.

E N D
All liquid or solid phase aqueous particles that originate in the atmosphere and fall to the earth's surface. The amount, usually expressed in millimeters or inches of liquid water depth, of the water substance that has fallen at a given point over a specified period of time. PRECIPITATION
Kiyose Otemachi 50 km REGIONAL INSTANTANEOUS RADAR IMAGE Radar image over the area around Tokyo for 1330 JST 12 Aug. 2006, in mm/h
GLOBAL PRECIPITATION CLIMATOLOGY (JULY) GPCP product averaged for July of the 27 years 1979-2005, in mm/d Based on infrared and microwave satellite data and rain gauge data http://precip.gsfc.nasa.gov/
Highly variable spatially and temporally Drive large-scale atmospheric dynamics by latent heat release in the tropics Cause devastating natural disasters Flood Drought PRECIPITATION IN NATURE
Short-term Nowcasting of severe storms Weather forecasting Flood control River management Medium-term Crop forecasting Long-term Climate monitoring USES OF PRECIPITATION OBSERVATIONS Many applications require the spatial pattern of precipitation in global and regional scale
PRECIPITATION MEASUREMENT SYSTEMS Satellite How does it measure rain from space? Radar Rain gauge
RAIN GAUGES AdvantagesDisadvantages Accurate; ‘truth’ Not representative of area Too sparse coverage over oceans
Advantages Observations in real time High space and time resolution Disadvantages Too sparse coverage over oceans and remote land areas Uncertainty in Z-R relationship Expensive to operate RADAR
Geostationary satellites Good time resolution (15-30 min) IR/VIS radiometer Good space resolution (1-4 km) Not direct measurement of rainfall No microwave radiometer Low-Earth orbit satellites Lower time resolution Twice per day for sunsynchronous satellite Microwave radiometer More Direct measurement of rainfall Lower space resolution (5-25 km) Met Satellites as Rain Measurement Systems
CO2 O3 O2 H2O **** Radiative Transfer Radiation changes through the atmosphere by the effect of absorption (emission) and scattering Gaseous Absorption Scattering by Ice Absorption (emission) by raindrops Absorption by cloud
Visible (VIS) Infrared (IR) Microwave (MW) SPECTRUM OF THE EARTH’S ATMOSPHERE Atmosphere is relatively transparent in the several portions of the spectrum (called ‘windows’)
Background VIS/IR observationsin near real timefrom geostationary satellites (INSAT, GOES, Meteosat, MTSAT etc.) Atmospheric gases arerelatively transparentin visible and infrared (10-12μm) portions ‘windows’ Clouds are opaqueat visible and infrared wavelengths VIS: cloud only a few tens of meters thick scatters all of the visible radiation incident on it IR: absorb nearly all of the infrared radiation (clouds act essentially as blackbodies) VISIBLE AND INFRARED TECHNIQUE
VISIBLE AND INFRARED IMAGERY MTSAT VIS channel (0.55 - 0.90μm) MTSAT IR1 channel (10.3 - 11.3μm) 27/Sep/2006 at 03:30 UTC
Principle: Rainfall at the surface is related to cloud properties observed from space B(Tc) Tc ? ? VISIBLE AND INFRARED TECHNIQUE IR cloud top temperature VIS reflected sunlight from cloud VIS/IR radiometer measures cloud-top properties instead of rain
VIS → Reflectivity Brighter – thicker clouds – likely heavier rainfall Dark – no rain IR → Brightness Temperature Colder – deeper clouds – likely heavier rainfall Warm – no rain VISIBLE AND INFRARED TECHNIQUE
Advantages High space and time resolution Observations in near real time Uniform resolution Observations unaffected by severe weather Disadvantages Estimate from cloud top information:Indirect Detect deep convective cloud Poor detection of rainfall from low warm cloud The relationship between CTT & Rainfall is not simple and not all cold clouds precipitate nor rain always come from cold clouds The relationship between Brightness in Visible image & Rainfall is much more complicated Calibration with raingauge is another problem VISIBLE AND INFRARED TECHNIQUE
Infrared(IR) SATELLITE SENSORS USED FOR RAINFALL ESTIMATION 8-12.5mm : “window wavebands” • Visible(VIS) 0.5-0.7mm
Infrared(IR) • Radiant energy is mainly absorbed by clouds. • Radiant energy is a function of temperature of the target(a rain cloud). Fig. 1 spectral radiance observed by Satellite(Nimbus-4) (a) Sahara Desert (b) Mediterranean Sea (c) Antarctica
Clouds are relatively cold in IR images. Infrared(IR) ・ temperature of cloud tops ・ height of clouds Fig. 2 vertical profile of temperature of U. S. Standard Atmosphere
Clouds are relatively bright in visible images for their high reflective property. Visible(VIS) ・ thickness of clouds ・ geometry of clouds ・ composition of clouds
Many different cloud types can be identified through VIS & IR images.
Bright clouds in VIS image produce much rainfall. Expanding rain clouds produce much rainfall. Decaying clouds produce little or no rainfall. Clouds with cold tops in IR images produce much rain. Clouds with cold tops that are becoming warmer produce little or no rainfall. Merging of Cb clouds increases the rainfall rate of merging cloud. Most of the significant rainfall occurs in upwind at anvil level a portion of convective system. The highest and coldest clouds form where the thunderstorms are most vigorous and rain heaviest. RAIN CLOUDS in IR & VIS images
Visible & Infrared Techniques Cloud indexing Bispectral Techniques Life-History Techniques Cloud Model Techniques VARIOUS METHODS OF RAINFALL ESTIMATION
Barret(1970) was the pioneer. He used nephanalysis of ESSA(Environment Science Service Administration) to estimate monthly rainfall. Follansbee(1970) used after noon visible images and visually assigned fraction of areas coverd by CB (r =1inch/day),NS(r =0.25inch/day) and Cu congestus (r =0.02inch/day) Follansbee and Oliver (1975) estimated cool precipitation. Cool season in Extra-trpoics is dominated by eastward moving systems which produce rain with variable intensities. They used two images that are separated by 12h and demarcated the clouds that are expected to rain and forecast the movement of the system. Thereby they found the no. of hours a place is likely to rain They used the monthly normal PN to correct the variable state of rain. The equation used is: P12 = 0.0075 * D * PN where D is duration in hours CLOUD INDEXING TECHNIQUES
CLOUD INDEXING TECHNIQUES Kilonsky and Ramage (1976) - Their technique is still being used - Used Visible mosaics of NESDIS. - Located HRC (Highly reflective clouds) - HRC is related to pptn. - Worked better over GATE area The equn used is Monthly rainfall R = 62.6+ 37.4 ND, where ND is no. of days HRC was seen
GOES Precipitation Index, Arkin(1979). To estimate tropical rainfall for climatological purose Over GATE area the radar estimate was highly correlated (0.86) to the fraction of area covered by pixels colder than 235K Richards & Arkin tested it over area 0.5x0.5 deg and 2.5x2.5 and found the correllations increase with averaging area and time Used rain rate of 3mm The precise equation is GPI = 3 f Δt Where f is fraction of area colder than 235K i.e f = No. of pixels with temp < 235K/ Total No. of pixels & Δt is time in hours ( if images are collexcted each 3hrs, the t = 3) the rain rate rr =3.0 (mm/hr) CLOUD INDEXING TECHNIQUES
GOES Precipitation Index, Arkin(1979). ・Exercise (a) and (b) are 0.5 × 0.5 deg. boxes, and the numbers are temperature(K) of each pixel in the boxes, respectively. What is the rainfall(rate(mm/hr)) for each box ? RR = ( 4 / 16 ) ×3.0 = 0.75 (mm/hr) RR = ( 10 / 25 ) ×3.0 = 1.2 (mm/hr)
238 236 234 237 244 230 234 240 236 225 224 238 238 231 232 245 Fraction = 7/16 = 0.44 GPI (GOES Precipitation Index) • Arkin and Meisner (1987) • IR window channel: cloud top temperature • Radar-estimated precipitation is highly correlated with the fraction of the area covered by pixels colder than a threshold (235K) • The correlation increases with averaging area and time (2.5° latitude-longitude) Arkin (1979)
GPI (GOES Precipitation Index) • GPI = 3.0 x Fc x t Fc: fraction of pixels with TB < 235K t: time for which Fc applies • Valid for the tropics and warm season extratropics
VIS (bright) > (dark) IR (cold) > (warm) BISPECTRAL TECHNIQUES ( TSONIS AND ISAAC (1985)) Distinguish rainclouds using following properties.
The rain rate of a convective cloud is a function of its stage in it’s life cycle Need Geostationary images Stout, Martin & Sikdar found that the time rate of change of Cirrus anvil and rain rate are related The essential point is that the rain rate peaks while the cloud is rapidly growing; it is much reduced at the time of max area They approximated the above characteristic by adding a term to the rain rate equation R = aoA +a1 dA/dt, A is cloud area, ao and a1 are coefficients and dA/dt is the time rate of change of cloud area They adopted a count of 172 to define clouds in Visible and 160 in IR R is volumetric rain rate. It is the volume of water falling from the cloud per unit time LIFE-HISTORY TECHNIQUES
Based on convective cloud area. LIFE-HISTORY TECHNIQUES Griffith et al.(1978), Woodley et al.(1980) → 1) growing cloud 2) shrinking cloud Rv = I × Ae Rv : rain volume per hour(m3h-1) I : rain slope(m3km2h-1) 1) 15.6 ×10³ (m3km2h-1) 2) 7.92 ×10³ (m3km2h-1) Ae : rain area The thresholds to identify convective clouds : 253 (K) for IR 135 (Wm-2) for VIS
LIFE-HISTORY TECHNIQUES ・Exercise What is the rain volume(m3h-1) on each condition ? (a) Sensor type : IR Ae : 10 (km2) Ac : 40 (km2) Am : 70 (km2) Rv = 15.6 ×103 × 10 = 1.56 ×10⁵ (m3h-1) (b) Sensor type : VIS Ae : 1 (km2) Ac : 12 (km2) Am : 20 (km2) Rv = 7.92 ×103 × 1 = 7.92 ×10³ (m3h-1)
Cloud Model Techniques • To improve the precipitation estimation using Vis-IR techniques, we need to incorporate the physics of the cloud. One way is to use cloud Models. • Earliest attempt by Gruber (1973). He used Florida Area Cumulus Experiment (FACE) data from jun-jul 1970 to to develop his scheme. • Consider a grid box in to which moisture is flowing at the rate of I. If Q is the amount of moisture necessary to saturate the grid. Then the rate at which the box is filling with cloud is I/Q. Convective clouds do not live for ever. Suppose all the clouds that form are convective and have same life time tL. Then the rate at which clouds are dying is tL/c, where c is fractional cloud cover. One makes the further assumption that the rate of influx of moisture i is exactly the same as the rain rate r, then rain rate is given by R = Qc/tL
Verification of satellite precipitation estimates is difficult at best Comparison with gauge data Rain gauges make very accurate measurements Different sampling area Gauge – 10-1m2 Satellite – 106-108m2 Comparison with radar estimate Radar samples area comparable with the size of satellite pixels Less accurate than gauge VERIFICATION
Global Precipitation Climatology (January) GPCP product averaged for January of the 27 years 1979-2005, in mm/d http://precip.gsfc.nasa.gov/