Download
1 / 33
330 likes | 478 Views
EPPrePMex, A Real-time Rainfall Estimation System Based on GOES-IR Satellite Imagery. Jorge Sánchez-Sesma Marco Antonio Sosa Chiñas* IPWG, October 2004, Monterey, California, USA. Conclusions. Introduction. Theory and Techniques. Georeference

E N D
EPPrePMex, A Real-time Rainfall Estimation System Based on GOES-IR Satellite Imagery Jorge Sánchez-Sesma Marco Antonio Sosa Chiñas* IPWG, October 2004, Monterey, California, USA
Theory and Techniques • Georeference • (IR Brightness)-(Cloud Top Temperature) Relationship • The Convective and Stratiform Technique (CST) • Storm Localization and Assesment
Convective and Stratiform Technique (CST) • Detection of Convective, stratiform and cirrus clouds • Tmin < 253°K • For each convective storm its intensity, rC, is: • Over an area • Where rC = rC0 - rC1 TC
Convective and Stratiform Technique (CST)(Storm radius)-(Cloud top temperature) A Relationship for Mexico
Implementation • Algorithm • Images • Products • Webpage
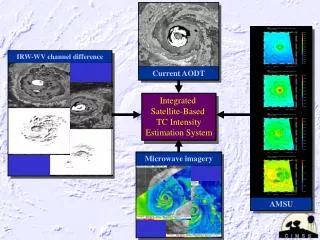
B C A Operational Results: Pseudo-imagery A:IR Images B:Intensity P-Image C:Acumulated P-Image
Operational Results : Numerical Reports • For basins and sites Lluvia acumulada promedio de 10051503.ACU en las regiones de cuencas.pol Región Promedio Millones de m3 Lerma - Santiago 1.661 226.489 Balsas 7.625 899.673 Guerrero - Costa 1.416 19.776 Pinotepa 21.165 822.995 Huatulco 20.368 225.329 Tehuantepec 29.847 488.984 Chiapas - Pacífico 2.248 27.191 Zacatecas - Nuevo León - San Luis Potosí 0.054 4.850 Tamaulipas 0.000 0.000 Huasteca 10.020 972.349 Pánuco 40.112 1081.230 Papaloapan 42.953 2510.730 Istmo - Golfo 11.258 331.346 Grijalva 1.463 150.828 Campeche 0.052 1.276 .. Promedio en la proximidad de puntos, tomado de 10051503.ACU Distancia para promedio: 7 Nombre Long. Lat. Prom. Centro Min. Max. .. #1022 VER Jalapa -96.920 19.550 39.50 34.00 30.75 45.00 #1023 VER La Cangrejera -94.900 17.980 17.08 28.25 8.12 29.25 #1024 VER La Joya -97.620 20.560 34.41 39.25 15.25 39.25 #1025 VER Las Perlas -94.650 17.770 0.56 1.00 0.00 1.00 #1026 VER Los Hules -98.270 21.160 17.97 15.62 15.62 21.38 #1027 VER Martinez De La Torre -97.050 20.067 70.81 70.62 70.62 71.12 #1028 VER Mizantla -96.970 20.170 71.94 72.00 71.00 72.62 #1029 VER Minzapan -96.890 20.000 71.92 72.25 71.38 72.38 #1030 VER Rio Grande -94.370 17.280 3.22 3.25 3.12 3.25 #1031 VER Orizaba -97.100 18.850 21.92 21.62 13.50 28.12 #1032 VER Oxtlapa -97.100 19.350 33.47 24.62 14.25 45.88 #1033 VER Panuco -98.170 20.510 29.07 32.50 24.25 33.25 ..
Graphical Binnacle • A graphical binnacle displays the processed images. Each dot indicate a processed image and its size indicates the number of storms.
Web page • A web page was designed and instaled in the same server nimbus, in which EPPrePMex is running in IMTA´s Offices. • Its adress is http://nimbus.imta.mx • It is working since the summer 1999.
Evaluation • NOAA comparison 1998-1999 • Site comparison 1997-2002 • Basin comparison 1997-2002
Evaluation • In 1998 the NOAA has made a comparison of estimated (Autoestimator and EPPrePMex) and measured daily accumulated rainfalls for Southern Texas
Evaluation Correlation between EPPrePMex estimations & RFCwide stations measurements of daily rainfall for July-Oct 1999
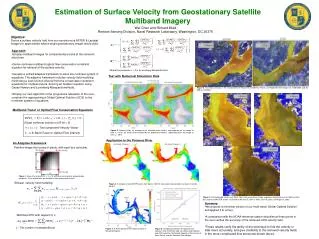
Evaluation Correlation between EPPrePMex estimations & NW Mexico stations measurements of daily rainfall for July-Oct 1998
Evaluation Rainfall measurements made by the operational hydrological network
Evaluation Measured (gage) Estimated (GOES satellite) A B INCOMPATIBLE A’ B’ COMPATIBLE
Present Research • Operational rainfall estimation based of GOES-12 and GOES-10, radars and weather stations • Real-time Calibration of rainfall estimation with satellites and radar • Detection and analysis of MCC • Clasification of storms • Calibration of GOES based estimation with other satellites (Tiros, SSMI, TRMM, Acqua, etc). • Integration with modern (distributed) hydrological models (MIT and others)
GOES-12 complemented with GOES-10 During eclipses GOES-10 imagery will complement GOES-12.
The End ¡Thank you very much!