Download
1 / 5
50 likes | 56 Views
Water pollution is one of the major global environmental problems. It is an acute problem almost in all major rivers and water reservoirs in India. Water pollution is increasing and becoming severe day by day and posing a great risk to human health and other living organisms. There is growing concern on the deterioration of ground water quality due to geogenic and anthropogenic activities. Present investigation aims at insight about the level of contaminants of surface water, groundwater and sediment analysis of selected rivers of Krishna River located in Mahuli and Urmodi river located in Nagthane, Satara district. An attempt has been made to assess the water quality, sediment analysis of the samples. Dissolved oxygen content of the water samples was observed quite well in limits such as in Krishna river Mahuli DO was 27.68mg L and in Urmodi river Nagthane was13.68mg .In the present study, COD value was observed by 720mg l at surface water of Krishna River Mahuliand 1320 mg l at surface water sample of Urmodi river Nagthane. As expected groundwater samples showed values of hardness within a limit. There is an urgent need for more representative samples to be used to go beyond preliminary assessment as reported in the present study for making appropriate recommendations. Pallavi Dhekale | Pranjal Nikam | Sagar Dadas | Chetana Patil "Water Quality and Sediment Analysis of Selected Rivers at Satara District, Maharashtra" Published in International Journal of Trend in Scientific Research and Development (ijtsrd), ISSN: 2456-6470, Volume-3 | Issue-6 , October 2019, URL: https://www.ijtsrd.com/papers/ijtsrd28062.pdf Paper URL: https://www.ijtsrd.com/pharmacy/medicinal-chemistry/28062/water-quality-and-sediment-analysis-of-selected-rivers-at-satara-district-maharashtra/pallavi-dhekale<br>

E N D
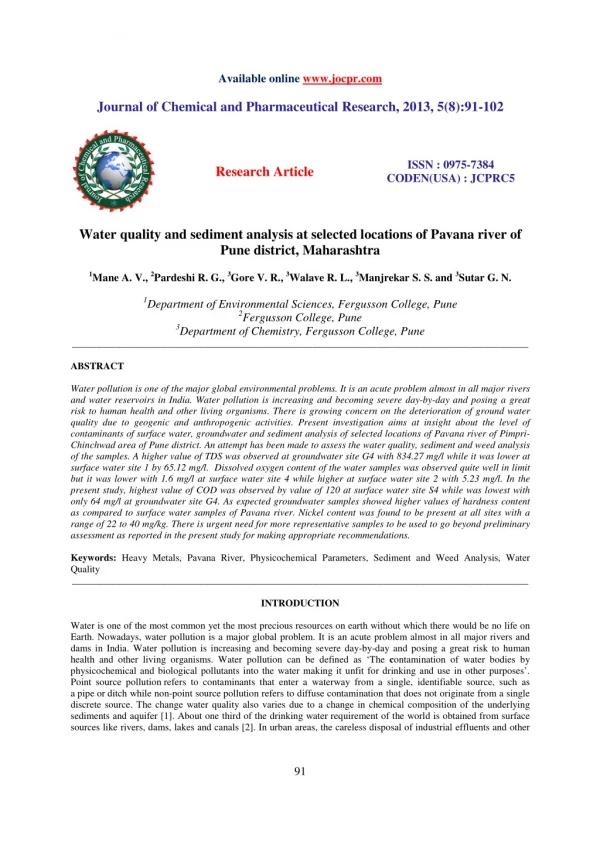
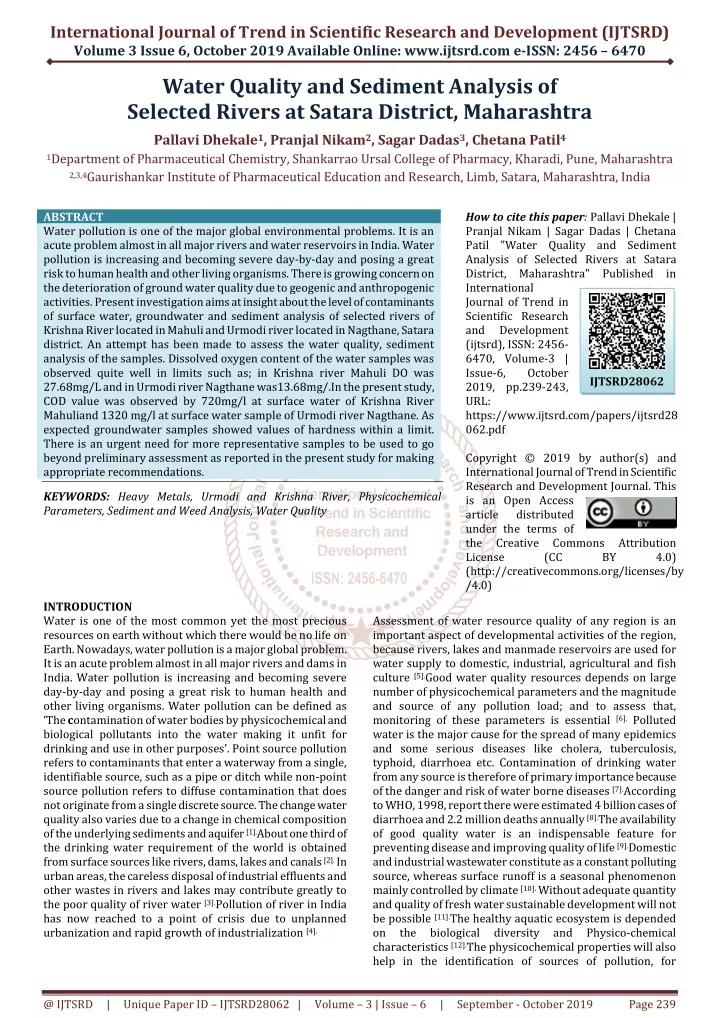
International Journal of Trend in Scientific Research and Development (IJTSRD) Volume 3 Issue 6, October 2019 Available Online: www.ijtsrd.com e-ISSN: 2456 – 6470 Water Quality and Sediment Analysis of Selected Rivers at Satara District, Maharashtra Pallavi Dhekale1, Pranjal Nikam2, Sagar Dadas3, Chetana Patil4 1Department of Pharmaceutical Chemistry, Shankarrao Ursal College of Pharmacy, Kharadi, Pune, Maharashtra 2,3,4Gaurishankar Institute of Pharmaceutical Education and Research, Limb, Satara, Maharashtra, India ABSTRACT Water pollution is one of the major global environmental problems. It is an acute problem almost in all major rivers and water reservoirs in India. Water pollution is increasing and becoming severe day-by-day and posing a great risk to human health and other living organisms. There is growing concern on the deterioration of ground water quality due to geogenic and anthropogenic activities. Present investigation aims at insight about the level of contaminants of surface water, groundwater and sediment analysis of selected rivers of Krishna River located in Mahuli and Urmodi river located in Nagthane, Satara district. An attempt has been made to assess the water quality, sediment analysis of the samples. Dissolved oxygen content of the water samples was observed quite well in limits such as; in Krishna river Mahuli DO was 27.68mg/L and in Urmodi river Nagthane was13.68mg/.In the present study, COD value was observed by 720mg/l at surface water of Krishna River Mahuliand 1320 mg/l at surface water sample of Urmodi river Nagthane. As expected groundwater samples showed values of hardness within a limit. There is an urgent need for more representative samples to be used to go beyond preliminary assessment as reported in the present study for making appropriate recommendations. KEYWORDS: Heavy Metals, Urmodi and Krishna River, Physicochemical Parameters, Sediment and Weed Analysis, Water Quality How to cite this paper: Pallavi Dhekale | Pranjal Nikam | Sagar Dadas | Chetana Patil "Water Quality and Sediment Analysis of Selected Rivers at Satara District, Maharashtra" Published in International Journal of Trend in Scientific Research and Development (ijtsrd), ISSN: 2456- 6470, Volume-3 | Issue-6, October 2019, pp.239-243, URL: https://www.ijtsrd.com/papers/ijtsrd28 062.pdf Copyright © 2019 by author(s) and International Journal of Trend in Scientific Research and Development Journal. This is an Open Access article distributed under the terms of the Creative Commons License (CC (http://creativecommons.org/licenses/by /4.0) IJTSRD28062 Attribution BY 4.0) INTRODUCTION Water is one of the most common yet the most precious resources on earth without which there would be no life on Earth. Nowadays, water pollution is a major global problem. It is an acute problem almost in all major rivers and dams in India. Water pollution is increasing and becoming severe day-by-day and posing a great risk to human health and other living organisms. Water pollution can be defined as ‘The contamination of water bodies by physicochemical and biological pollutants into the water making it unfit for drinking and use in other purposes’. Point source pollution refers to contaminants that enter a waterway from a single, identifiable source, such as a pipe or ditch while non-point source pollution refers to diffuse contamination that does not originate from a single discrete source. The change water quality also varies due to a change in chemical composition of the underlying sediments and aquifer [1].About one third of the drinking water requirement of the world is obtained from surface sources like rivers, dams, lakes and canals [2]. In urban areas, the careless disposal of industrial effluents and other wastes in rivers and lakes may contribute greatly to the poor quality of river water [3].Pollution of river in India has now reached to a point of crisis due to unplanned urbanization and rapid growth of industrialization [4]. Assessment of water resource quality of any region is an important aspect of developmental activities of the region, because rivers, lakes and manmade reservoirs are used for water supply to domestic, industrial, agricultural and fish culture [5].Good water quality resources depends on large number of physicochemical parameters and the magnitude and source of any pollution load; and to assess that, monitoring of these parameters is essential [6]. Polluted water is the major cause for the spread of many epidemics and some serious diseases like cholera, tuberculosis, typhoid, diarrhoea etc. Contamination of drinking water from any source is therefore of primary importance because of the danger and risk of water borne diseases [7].According to WHO, 1998, report there were estimated 4 billion cases of diarrhoea and 2.2 million deaths annually [8].The availability of good quality water is an indispensable feature for preventing disease and improving quality of life [9].Domestic and industrial wastewater constitute as a constant polluting source, whereas surface runoff is a seasonal phenomenon mainly controlled by climate [10]. Without adequate quantity and quality of fresh water sustainable development will not be possible [11].The healthy aquatic ecosystem is depended on the biological diversity characteristics [12].The physicochemical properties will also help in the identification of sources of pollution, for and Physico-chemical @ IJTSRD | Unique Paper ID – IJTSRD28062 | Volume – 3 | Issue – 6 | September - October 2019 Page 239
International Journal of Trend in Scientific Research and Development (IJTSRD) @ www.ijtsrd.com eISSN: 2456-6470 conducting further investigations on the eco-biological impacts and also for initiating necessary steps for remedial actions in case of polluted water bodies[13]. In India, many researchers have worked on physicochemical and biological characteristics of reservoirs and rivers [4, 14, 15, 16, 17, 18, 19, 20]. Although statistics vary, the World Health Organization (WHO) reports that approximately 36% of urban and 65% of rural Indian’s were without access to safe drinking water [21]. Ground water is an essential and vital component of our life support system. The ground water resources are being utilized for drinking, irrigation and industrial purposes. There is growing concern on the deterioration of ground water quality due to geogenic and anthropogenic activities. Thus, Freshwater has become a scare commodity due to over exploitation and pollution [22]. Uncontrolled domestic wastewater discharge into pond has resulted in eutrophication of ponds as evidence by substantial algal bloom, dissolve oxygen depletion in the subsurface water leads to large fish kill and other oxygen requiring organism [23]. The natural and human activities over the years have contributed towards continuous built up of toxic metals in water bodies. Human activities such as mining and smelting of metals, electroplating, gas exhaust, energy and fuel production, fertilizers, sewage and pesticides, municipal waste generations are contributing for heavy metal pollution [24] which has become one of the most severe environmental problems today. The content of heavy metals in river bottom sediments is often used as an indicator of their anthropogenic pollution contaminated sediment has become one of the most environmental issues. Both natural and human activities effect the composition of the sediment [26].It is also well known that river bottom sediments are not only sinks for heavy metals but also their sources. Though some of the metals like Cu, Fe, Mn, Ni and Zn are essential as micronutrients for life processes microorganisms, while many other metals like Cd, Cr and Pb have no known physiological activity, but they are proved detrimental beyond certain limit [27]. Monitoring these metals is an important task for safety assessment of the overall environment. Krishna River and UrmodiRiverflows through the cities of Mahuli and Nagthane. Due to outburst of rapid industrialization and urbanization of these cities, Krishna and Urmodi carries huge load of sediments, chemicals and varied industrial discharges. There is an urgent need to monitor the water quality of the river periodically; therefore, present investigation aims at insight about the level of contaminants of surface water, groundwater and sediment analysis of selected locations at Krishna river and Urmodi river of Mahuli and Nagthane area of Satara district. Sediment and weed analysis was carried out in order to find out the extent of metal accumulation and biological magnification. [25].In most of the rivers in plants and Fig. 1: Map of Krishna River Mahuli and Urmodi River Nagthane MATERIAL AND METHODS: All standard and well-known methods were used for the estimation of physico-chemical parameters of water and sediment analysis of the samples collected from selected sites of the city. Samples were collected from sites of Krishna River and Urmodi River, Mahuli and Nagthane of Satara district. The study was carried out in the month of July 2017. The distance between each site was nearly about 25km Ground water, surface water, sediments and weed samples were collected from each site. Each water sample is collected in 1000 ml plastic container while dissolved oxygen was fixed on site and then analyzed in the laboratory. Sediment samples and weed samples were collected in plastic bags and treated further in laboratory for analysis. All water samples were preserved carefully. Weed and sediment samples were dried in oven and powdered form was used for further analysis. Metal concentrations were determined by using Atomic Absorption Spectroscopy (AAS) while other water parameters were estimated by using routine laboratory instruments. Each parameter was estimated for two times and average value was considered as final result. 1.Selected Site: Total of two sites were selected namely; 1: Krishna river Mahuli, 2: Urmodi river Nagthane. 2.Physico-Chemical Parameters: 2.1.pH: The pH was determined using Digital pH Meter335. The pH of water sample was directly determined with the electrode. The contents were stirred well and allowed to settle and supernatant was used to check pH. @ IJTSRD | Unique Paper ID – IJTSRD28062 | Volume – 3 | Issue – 6 | September - October 2019 Page 240
International Journal of Trend in Scientific Research and Development (IJTSRD) @ www.ijtsrd.com eISSN: 2456-6470 2.2.Dissolved Oxygen (DO): Dissolved oxygen content of the water samples was measured by using Winkler’s method (modified azide method). The sample was collected in 300 ml bottle and DO was fixed on site by using 1 ml each of Manganoussulphate and Alkaline-iodide-azide. The precipitate formed was dissolved in laboratory by using sulphuric acid and titrated with sodium thiosulphate using starch as an indicator. The end point of titration was blue to straw pale colour. ml of titrant x N x 1000 x 8 DO (mg/L) = V2 (V1- V2)/V1 V1=volume of BOD bottle, V2=volume of content titrated and V= volume of MnSO4 and Alkaline-iodide-azide. 2.3.Chemical Oxygen Demand (COD): COD determination was carried out with dichromate reflux method with the addition of 10 ml of 0.25 N potassium dichromate (K2Cr2O7) and 30 ml H2SO4+Ag2SO4 reagent in 20 ml diluted sample. The mixture was refluxed for 2h and was cooled to room temperature. The solution was then diluted to 150 ml by using distilled water and excess K2Cr2O7 remained was titrated with ferrous ammonium sulphate (FAS) using ferroin indicator. COD (mg/L) = (A- B) x N x 1000 x 8 Volume of Sample Where, A is the ml of FAS used for blank; B is the ml of FAS used for sample, N is the normality of FAS and 8 is milli equivalent weight of oxygen 2.4.Biological Oxygen Demand: The dilution method was followed to determine the BOD after three days at 27oC. For the same dilution water was prepared with the addition of nutrients namely phosphate buffer, magnesium sulphate, calcium chloride and ferric chloride. The diluted sample was transferred to BOD bottles of 300 ml capacity. After determining initial dissolved oxygen (DO), final DO was estimated from the bottles kept for incubation period for three days. 2.5.Alkalinity of Water sample: 10 ml of water sample was mixed with 2-3 drop of phenolphthalein. The development of pink colour to the RESULTS AND DISCUSSION: TABLE 1: WATER QUALITY ANALYSIS OF SAMPLE OF KRISHNA RIVER MAHULI, SATARA. Sr. No. pH DO COD 1) 7.4 (±0.02) 27.68 (±0.21) 720 (±5.05) 41.63 (±1.24) TABLE 2: WATER SEDIMENT ANALYSIS OF KRISHNA RIVER MAHULI, SATARA. Sr. No. Organic Carbon in Sediment (%) 1) solution indicated the presence of alkalinity and was then titrated with 0.02N H2SO4 till the colour disappears. Volume of Sample Alkalinity = B x N x 50 x 1000 2.6.Total Hardness of Water sample: The total hardness of the water samples was determined by EDTA titration method where 50 ml of well mixed sample was mixed with 1-2 ml buffer of pH 10 and a pinch of Moderant black indicator. The contents were thentitrated with0.01M EDTA till wine red solution changes to blue. Hardness (mg/L) = C x D x 1000 ml of Sample Where C=ml of EDTA for titration, D= mg of CaCO3equivalent to 1ml of EDTA 2.7.Free Carbon dioxide of Water sample: Free CO2 was determined with 20 ml of sample in a conical flask and with the addition of phenolphthalein indicator. Colorless solution was then titrated with 0.05N NaOH to obtain pink as an end point. FreeCO2 = A×N×44×1000 Volume of Sample A= ml of titrant. N= normality of NaOH 2.8.Organic Carbon in Sediment: 0.50 g dried soil sample was taken in a conical flask. 10 ml 1 N Potassium dichromate and 2 ml con. H2SO4was added and allowed to stand for 30 min. the volume was adjusted with 200 ml distilled water and then 10 ml orthophosphoric acid and pinch of Moderant black indicator was added. The solution thus obtained was titrated with 0.5N FAS solution. End point was blue-violet to green. Similarly blank was run with distilled water. Organic carbon (%) 10 (B-T) × 0.003 × 1000 B × S B= Vol. of FAS for blank, T= Vol. of FAS for soil sample, S= Wt. of soil in gm. BOD Alkalinity _ Hardness 17.8 (±2.10) 44 (±0.23) Free CO2 5.38 (±0.1) TABLE 3: WATER QUALITY ANALYSIS OF SAMPLE OF URMODI RIVER NAGTHANE, SATARA. Sr. NO. pH DO COD 1) 8.3 (±0.02) 13.68 (±0.21) 1,320 (±5.05) 48.56 (±1.24) 70 (±1.10) 15 (±2.10) 66 (±0.23) TABLE 4: WATER SEDIMENT ANALYSIS OF URMODI RIVER NAGTHANE, SATARA. Sr. No. Organic Carbon in Sediment (%) 1) 4.61 (±0.1) BOD Alkalinity Hardness Free CO2 @ IJTSRD | Unique Paper ID – IJTSRD28062 | Volume – 3 | Issue – 6 | September - October 2019 Page 241
International Journal of Trend in Scientific Research and Development (IJTSRD) @ www.ijtsrd.com eISSN: 2456-6470 pH: pH is the measurement of the potential activity of hydrogen ions in the sample. By the definition, pH is the negative logarithm of hydrogen ion concentration, more precisely hydrogen ion activity. pH of the water body is affected by several factors. pH is not static, it changes over time, in fact it changes over the course of an hour or day. The leaching of soils, organic matter and rocks is influenced by pH[48]. The desirable range of pH for drinking water is from 7.0 to 8.5. The majority of waters are slightly basic (i.e. generally over 7.0) because of the presence of carbonate and bicarbonate ions. In the present investigation, the minimum pH was observed to be 7.4 of ground water of Krishna river and 8.3 Urmodi river All the pH values were in normal range and as per acceptable limit with slightly alkaline values. Generally, the obtained pH values fall within the World Health Organization standard of 7.0 to 8.5 and the water quality ranges 6.5 to 8.5 for drinking water and water meant fo full contact recreation, respectively [28]. The EU also sets pH protection limits of 6.0 to 9.0 for fisheries and aquatic life [29].The fluctuations in optimum pH ranges may lead to an increase or decrease in the toxicity of poisons in water bodies [30]. Dissolved Oxygen (DO): Dissolved oxygen concentrations in unpolluted water normally range between 8 and 10 mg/l and concentrations below 5 mg/l adversely affect aquatic life [34].DO standard for drinking purpose is 6 mg/l whereas for sustaining fish and aquatic life is 4-5 mg/L [34].For water quality variable such as dissolved oxygen, water quality criteria are set at the minimum acceptable concentration to ensure the maintenance of biological function. Dissolved oxygen content of the water samples were observed quite well but it was more with 1.6 mg/l at surface water site 4 while higher at surface water site 2 with 5.23 mg/l. Biological oxygen demand increases due to biodegradation of organic materials which exerts oxygen tension in a water body [35].Dissolved oxygen present in drinking water adds tasteand it is highly fluctuating factor in water [36]. Chemical Oxygen Demand (COD): Chemical oxygen demand is an important water quality parameter in order to assess the pollution load into the water source. COD is the measure of amount of oxygen required by both potassium dichromate and concentrated sulphuric acid to breakdown both organic and inorganic matters. It is commonly used to indirectly measure the amount of organic compounds in water. The measure of COD determines the quantities of organic matter found in water[48]. This makes COD useful as an indicator of organic pollution in surface water [37].In the present study, highest value of COD was observed by value of 1320 at surface water of Urmodi river while lowest was with only 720 mg/l at groundwater Krishna river. In the conjunction with the BOD test, the COD test is helpful in indicating toxic conditions and the presence of biologically resistant organic substances. Biological Oxygen Demand (BOD): Biological oxygen demand is the measure of oxygen required by microorganisms whilst breaking down organic matter[48]. Highest value of BOD was observed by vale of 48.56 at surface water sample of Urmodi River while lowest was with only 41.63 mg/l at Krishna river. All the sites thus indicated the higher values for BOD and are the indication of organic load on the water source. BOD is used as the index of organic pollution of waste water that can be decomposed by bacteria under anaerobic conditions. Alkalinity: Alkalinity measures the ability of a solution to neutralize acids the equivalence point of carbonate or bicarbonate. In the natural environment carbonate alkalinity tends to make up most of the total alkalinity due to the common. Occurrence and dissolution of carbonate rocks and presence of carbon dioxide in the atmosphere. Alkalinity of the water samples was quite high with highest value (70 mg/l) at Urmodi river. No alkalinitywas found in sample of Krishna river due to pH 7.4 almost near to neutral pH. Free CO2: Free CO2 content of the water bodies also represents the rate of degradation and release of CO2 in water bodies which later again decrease the dissolved oxygen content of the water bodies. The value was highest at surface water river sample with 66 mg/l indicating higher release of CO2 due to degradation of organic wastes. The lower value was observed at the by a value of 44 mg/l at surface water at Urmodi river. According to Dwivedi and Pandey[39] concentration of free CO2 in water increases due to Increasing algal blooms which creates a barrier between atmosphere and water for gaseous exchange. Hardness: Total hardness mainly depends upon the dissolved salts present in water. Hard water is water that contains high levels of dissolved calcium, magnesium and other mineral salt such as iron. The greater is amount of dissolved minerals in water, more is the water hard. Hard water forms deposits that clog plumbing. These deposits, called scale, are composed mainly of calcium carbonate, magnesium hydroxide and calcium sulphate. As expected groundwater samples showed higher values of hardness content as compared to surface water samples of the Krishna river and Urmodi river. The higher value of hardness was observed at groundwater sample of Krishna river by 17 mg/l while it was lower by a value of 15 mg/l at surface water of Urmodi river[48]. Sediment Analysis: Krishna River is 5.38 and is the indication of higher fertility of the sediment soil and lower in Urmodi river is 4.61All the sites showed good amount of organic carbon content. CONCLUSION: In the present investigation, an attempt has been made to assess water quality with reference to physicochemical properties, heavy metals, sediment of the riverine (local) area of Satara District. The Krishna and Urmodi rivers were observed to be polluted because of forming human waste remedies. The Krishna River was most polluted than Urmodi River, because the COD and BOD values were 720mg/l and 41.63mg/l respectively. Hardness of Krishna river was 17.8mg/l and Urmodi river was15mg/l, these values were observed within in limit. The survival of aquatic animals is less because of highest values of COD and BOD. Sediment collected from rivers showed highest levels of carbon contents in the water. Sources of wastewater from industries and residential areas, washing clothes, cars and dumping of garbage was observed on these sites. It was also observed that the natural quality of water resources is getting deteriorated at faster rate. @ IJTSRD | Unique Paper ID – IJTSRD28062 | Volume – 3 | Issue – 6 | September - October 2019 Page 242
International Journal of Trend in Scientific Research and Development (IJTSRD) @ www.ijtsrd.com eISSN: 2456-6470 REFERENCES: [1]A Jameel; Indian J. Env. Proct., 44(2), 108-112 (2002). [2]SB Jonnalagada; and G Mhere, Water Res., 35: 2371- 2376 (2001). [3]V Emongor; E Kealotswe; I Koorapetse; S Sankwasa and S Keikanetswe., Journal of Applied Sciences. 5,147-150 (2005). [4]DN Saksena; RK Garg and RJ Rao, Journal of Environmental Biology, 29(5), 01-710 (2008). [5]GR Jackher; and M Rawat, India. J. Aqua. Biol., 18: 79-83 (2003). [6]KR Reddi, N Jayaraju; I Suriyakumar; and K Sreenivas, Ind. J. Mar. Sci., 22: 223-234 (1993). [7]MO Edema; AM Omemu; OM Fapetu; Niger. J. Microbiol. 15(1): 57-61 (2001). [8]CL Chan, MK Zalifah; and AS Norrakiah, The Malaysian Journal of Analytical Science, 11 (2), 414-420 (2007). [9]AO Oluduro; BI Adewoye; J. Plant Sci. 6. 453-438 (2007). [10]KP Singh; A Malik; D Mohan and S Sinha, Water Res., 38, 3980 (2004). [11]HB Mahananda, MR Mahananda; and BP Mohanty, Ecology Environment & Conservation.11 (3-4), 537- 541(2005). [12]K Venkatesharaju; P Ravikumar; RK Somashekar; KL Prakash, Journal of Science, Engineering and Technology, 6(1), 50-59 (2010). [13]UK Ekwenye; CA Oji, Environ. Ecol. 26: 543-545, (2008). [14]RK Trivedy; and PK Goel, Environmental Publication, Karad, Maharashtra (1986). [15]GR Jakhar; SC Bhargava; and RK Sinha, Geobiology (1990). [16]S Rao; Fresh Water Molluscs of Indian Recent Advances in Fresh Water. Anmol Publications Pvt. Ltd. NewDelhi Pp. 47-52 (1993). [17]S Patil; and JM Patwari; J. Aquatic Biology, Vol. 18(2): 85-86 (2003). [18]A Shayestehfar; M Soleimani; SN Mousavi; and F Shirazi, Iran Journal of Environmental Biology, 29(5), Pp715-720 (2008). [19]RN Barik; and RK Patel, Indian Journal of Environmental Protection, 24 (03), 161-166 (2004). [20]RK Gaur; AA Khan; A Alam; and Md A Alam, Indian Journal of Environmental Protection, 20(3), 165- 170(1997). [21]World Health Organization, Guidelines for Drinking water quality, Volume 1: 3rd edition, WHO Press, Switzerland (2009). [22]GK Gupta; R. Shukle, Pollution Research, 23 (4): 205- 209(2006). [23]Pandey, Hydrol. Proc., 10 (2), 131-295 (165 Pages) (2003). [24]A Amman; B Michalke; P Schramel, Anal. Biochem., 372, 448-452 (2002). [25]E Helios-Rybicks; Researches of Quaternary Sediments. Polish Geological Institute (1995). [26]AK Rai; SN Upadhyay; S Kumar and YD Upadhyay, J. of IAEM .25:22-51 (1999). [27]MR Bruins; S Kapil; FW. Oehme, Ecot ox. Environ.Safe. 45, 198-207 (2000). [28]DWAF, 1996, South African Water Quality Guidelines, (Volume 2), Recreational Ed.).Department of DWAF, WRC, (1995), South African Water Quality Management Series. WRC Report No. 24 TT64/94. Department Of Water Affairs and Forestry and Water Research Commission, Pretoria. [29]D Chapman, Water Quality Assessments: A Guide To The Use Of Biota, Sediments And Water In Environmental Monitoring 2nd. Ed. UNESCO, World Health Organization, United Nations Environment Programme, London (1996). [30] J Ali, 1991, An Assessment Of The Water Quality Of Ogunpa River Ibadan, Nigeria. M.Sc. Dissertation. University Of Ibadan, Ibadan, Nigeria. [31] HA Solanki; PU Verma and DK Chandawat, Life Sciences Leaflets 20:944-955(2011). [32] MR Mahananda, International Journal of Research and Review in Applied Sciences, 2 (3), 284-295 (2010). [33] PV Rao, Textbook Of Environmental Engineering. Eastern Economy Ed., PrivateLimited, New Delhi, Chapter 3, 280 (2005). [34] B Abida and H krishna, Journal of Chemistry, 5(2):377- 384 (2008). [35] N Patil; A Ahmed; H Sureshbabu; NM Kottureshwar; M Jayashree and J Nijalingappa, IJABPT. 1(2): 518- 523(2010). [36] F Ngwenya; Water Quality Trends in the Eerste River, Western Cape, 1990- 2005. A mini thesis submitted inpartialfulfillment of the requirements for the degree of Magister Scientiae, Integrated Water Resources Management in the Faculty of Natural Science, University of the Western Cape, pp 41 (2006). [37]CN Sawyer; LP Mccarty and GF Parkin, Chemistry for Environmental Engineering and Science, 5thEdition, TataMcgraw-Hill, 625-630 (2003). [38]BK Dwivedi and GC Pandey. Poll. Res.21 (3):361-370 (2002). [39]AJ Robson; and C Neal, Sci. Total Environ., 194-95: 15- 37(1997). [40]SS Asaolu; KO Ipinmoroti; CE Adeyinowo, O.Olaofe, Afr. J. Sci1: 55-61(1997). [41]USEPA; United States Environmental Protection Agency, Water Quality Monitoring For Coffee Creek (Porter County, Indiana). Retrieved Sept. 29, 2006, www.USEPA (2002). [42]AP Mucha; MTSD Vasconcelos; and AA Bordalo, Environmental Pollution 121: 169 -180 (2003). [43]EC, European Commission, Heavy Metals In Waste. Final Report DG ENV. E3. 86 (2002) [44]BT Hart; Hydrobiologia, 91: 299-313(1982). [45]GB Hagan; FG Ofosu; EK Hayford; EK Osae; and K Oduro-Afriyie, Research Journal of Environmental and Earth Sciences 3(4): 385-392, (2011). [46]NGBRA: National Ganga River Basin Authority (NGRBA), Draft, Environmental Management Framework (ESMF), Volume I - Environmental and Social Analysis, 2011, available at:http://moef.nic.in/downloads/public-information. [47]Mane A. V., et.al. Journal of Chemical and Pharmaceutical Research, 2013, 5(8):91-102 Water Use (2nd Pretice-Hall Of India and Social @ IJTSRD | Unique Paper ID – IJTSRD28062 | Volume – 3 | Issue – 6 | September - October 2019 Page 243