Download
1 / 7
70 likes | 71 Views
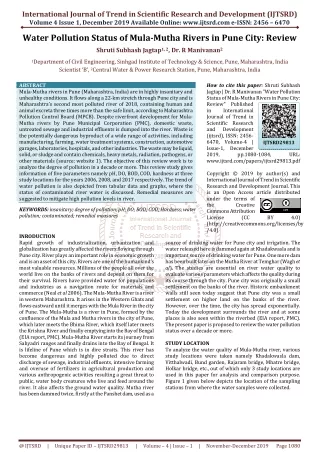
We wants to present an extensive work on physico chemical parameters of water samples of Mula Mutha river at Pune Maharashtra . Water samples under investigations were collected from Khadkwasla dam to Sangam Bridge during pre monsoon April May2016 monsoon July August2016 and post monsoon October November2016 seasons. The observed values of different physico chemical parameters like pH, DO, BOD, COD, Chloride, Nitrate, Sulphate, Calcium, Magnesium and Hardness, etc. of samples were compared with standard values recommended by world health organization WHO . The Mula Mutha River water in Pune had deteriorated in quality. Its biological oxygen demand, an indicator of organic pollution, has risen to over 30 mg l, more than ten times the permissible limits for bathing. Municipal Corporation is currently supplying water sufficient for the projected population. More water means more sewage, beyond the quantum its sewage treatment plants can treat. As a result there is greater pollution loads discharged in to the Mula Mutha, two rivers that confluence within city limits and serve to flush away Punes excreta. All the physico chemical parameters for pre monsoon, monsoon and post monsoon seasons are within the highest desirable or maximum permissible limit set by WHO except some of the parameters like DO, BOD,COD, chloride, calcium, magnesium and hardness. S.D.Jadhav | M.S. Jadhav "Analysis of Water Quality Using Physico-chemical Parameters of Mula-Mutha River, Pune (Maharashtra)" Published in International Journal of Trend in Scientific Research and Development (ijtsrd), ISSN: 2456-6470, Volume-1 | Issue-6 , October 2017, URL: https://www.ijtsrd.com/papers/ijtsrd2509.pdf Paper URL: http://www.ijtsrd.com/chemistry/analytical-chemistry/2509/analysis-of-water-quality-using-physico-chemical-parameters-of-mula-mutha-river-pune-maharashtra/sdjadhav<br>

E N D
International Research Research and Development (IJTSRD) International Open Access Journal Analysis of Water Quality using Physico-Chemical Parameters of Mutha River, Pune (Maharashtra) Mutha River, Pune (Maharashtra) International Journal of Trend in Scientific Scientific (IJTSRD) International Open Access Journal ISSN No: 2456 ISSN No: 2456 - 6470 | www.ijtsrd.com | Volume 6470 | www.ijtsrd.com | Volume - 1 | Issue – 6 Analysis of Water Quality using Physico Mula-Mutha River, Pune (Maharashtra) hemical Parameters of S.D. Jadhav M.S. Jadhav M.S. Jadhav ivil Engineering, Sinhgad Technical Education Society’s Sou. Venutai Chavan Polytechnic, Pune Department of Basic Science, Bharati Vidyapeeth University, College of Engineering, Pune Department of Basic Science, Bharati Vidyapeeth University, College of Engineering, Pune Department of Civil Engineering, Sinhgad Technical Education Society’s Sou. Venutai Chavan Polytechnic, Pune ABSTRACT We want to present an extensive work on physico chemical parameters of water samples of Mula river at Pune (Maharashtra). Water samples under investigations were collected from Khadkwasla dam to Sangam Bridge during pre monsoon (April May2016) monsoon (July – August2016) and post monsoon (October – November2016) seasons. The observed values of different physico parameters like pH, DO, BOD, COD, Chloride, Nitrate, Sulphate, Calcium, Hardness, etc. of samples were compared with standard values recommended by world health organization (WHO). The Mula-Mutha River water in Pune had deteriorated in quality. Its biological oxygen demand, an indicator of organic pollution, has risen to over 30 mg/l, more than ten times t permissible limits for bathing. Municipal Corporation is currently supplying water sufficient for the projected population. More water means more sewage, beyond the quantum its sewage treatment plants can treat. As a result there is greater pollution loads discharged in to the Mula-Mutha, two rivers that confluence within city limits and serve to flush away Pune's excreta. All the physico - chemical parameters for pre monsoon, monsoon and post monsoon seasons are within the highest desirable or maximum permissible limit set by WHO except some of the parameters like DO, BOD,COD, chloride, calcium, magnesium and hardness. Keywords: Physico-chemical parameters, Municipal Corporation, Mula-Mutha River Mutha River chemical parameters, Municipal We want to present an extensive work on physico- chemical parameters of water samples of Mula-Mutha river at Pune (Maharashtra). Water samples under investigations were collected from Khadkwasla dam to Sangam Bridge during pre monsoon (April – 1.INTRODUCTION Mula –Mutha River was a life line of residents of Punwadi and its water was used for domestic and agriculture purposes before 1960. Hence, effective maintenance of water quality was required through appropriate measurements. It is a fact that good water quality produces healthier humans than one with poor water quality. Physico chemical as well as micro-biological characteristics of water can describe the quality of water [20] hence, the analysis on physico-chemical parameters of Mula Mutha river water was made by many workers. Monitoring at regular intervals of all the parameters is very difficult and laborious task even if adequate manpower and laboratory facilities are available. Therefore, statistical correlation technique can be used for comparison of physico The present work deals with the study of 11 physico chemical parameters like pH, DO, BOD, COD, Chloride, Nitrate, Sulphate, Calcium, Magnesium and total Hardness,etc. The observed values of various physico-chemical parameters of water samples were compared with standard values recommended by World Health Organization [5] (WHO) and are given. The objective is to minimize the complexity and dimensionality of large set of data. Systematic calculation of correlation calculation of correlation Mutha River was a life line of farmers and residents of Punwadi and its water was used for domestic and agriculture purposes before 1960. Hence, effective maintenance of water quality was required through appropriate measurements. It is a fact that good water quality produces healthier humans than one with poor water quality. Physico- biological characteristics of water can describe the quality of water [20] hence, the chemical parameters of Mula- Mutha river water was made by many workers. nitoring at regular intervals of all the parameters is very difficult and laborious task even if adequate manpower and laboratory facilities are available. Therefore, statistical correlation technique can be used for comparison of physico-chemical parameters. The present work deals with the study of 11 physico- chemical parameters like pH, DO, BOD, COD, Chloride, Nitrate, Sulphate, Calcium, Magnesium and total Hardness,etc. The observed values of various chemical parameters of water samples were ared with standard values recommended by World Health Organization [5] (WHO) and are given. The objective is to minimize the complexity and dimensionality of large set of data. Systematic August2016) and post November2016) seasons. The observed values of different physico-chemical parameters like pH, DO, BOD, COD, Chloride, Nitrate, Sulphate, Calcium, Magnesium Magnesium compared with and and standard values recommended by world health Mutha River water in Pune had deteriorated in quality. Its biological oxygen demand, an indicator of organic pollution, has risen to over 30 mg/l, more than ten times the permissible limits for bathing. Municipal Corporation is currently supplying water sufficient for the projected population. More water means more sewage, beyond the quantum its sewage treatment plants can treat. As a result there is greater pollution Mutha, two rivers that confluence within city limits and serve to flush away chemical parameters for pre monsoon, monsoon and post monsoon seasons are within the highest desirable or maximum permissible limit set by WHO except some of the parameters like DO, BOD,COD, chloride, calcium, coefficient coefficient between between @ IJTSRD | Available Online @ www.ijtsrd.com @ IJTSRD | Available Online @ www.ijtsrd.com | Volume – 1 | Issue – 6 | Sep-Oct 2017 Oct 2017 Page: 250
International Journal of Trend in Scientific Research and Development (IJTSRD) ISSN: 2456-6470 physico-chemical parameters can be carried out and significant correlation can be further verified [2]. river as well as the natural springs was considered safe for all practical purposes, but now due to increase in industrialization the situation has changed. Hence it is required to analyze the water before using it for various purposes [11-12]. Water quality is a term used to express the suitability of water to sustain various uses or processes. Any particular use will have certain requirements for the physical, chemical or biological characteristics of water; for example limits on the concentrations of toxic substances for drinking water use, or restrictions on temperature and pH ranges for water supporting invertebrate communities [3-4]. Consequently, water quality can be defined by a range of variables which limit water use. Although many uses have some common requirements for certain variables, each use will have its own demands and influences on water quality. Quantity and quality demands of different users will not always be compatible, and the activities of one user may restrict the activities of another, either by demanding water of a quality outside the range required by the other user or by lowering quality during use of the water [5-6]. Efforts to improve or maintain a certain water quality often compromise between the quality and quantity demands of different users. There is increasing recognition that natural ecosystems have a legitimate place in the consideration of options for water quality management. This is both for their intrinsic value and because they are sensitive indicators of changes or deterioration in overall water quality, providing a useful addition to physical, chemical and other information7-9. 2.EXPERIMENTAL Water samples were collected from Khadkwasla dam to Sangam Bridge during pre monsoon(April - May), monsoon (July - August) and post monsoon (October - November) phase in year 2016 During sampling pH, was determined using digital pH meter. The laboratory analysis of samples was done using standard methods1 (APHA,1998), titrimetric method was used for the determination of total alkalinity and gravimetric method for total dissolved solid and total suspended solids Mohr’s argentometric titration method was used for chloride [27] . Sulphate was estimated using turbidometric method Whereas Ca+2, Mg+2 and TH was determined by EDTA titrimetric method [13]. The entire chemicals used were of AR grade. Observation Table No. I : Selected Sampling Stations Sr.No. Name of the sampling station Kharakwasla (Mutha river) 1 Vitthalwadi (Mutha river) 2 Water quality is affected by a wide range of natural and human influences. The most important of the natural influences are geological, hydrological and climatic, since these affect the quantity and the quality of water available. Their influence is generally greatest when available water quantities are low and maximum use must be made of the limited resource[10]. The standards for drinking water quality as well as for the river water are typically set by the Government and by International Standards. The main purpose of this International Body is to maintain the maximum and minimum contaminant levels in the water that is to be used for various purposes. Even the Garware Causeway(Mutha river) 3 Holkar Bridge (Mula river) 4 Wakad Causeway (Mula river) 5 Aundh Causeway (Mula river) 6 Bund Garden (Mula-Mutha river) 7 @ IJTSRD | Available Online @ www.ijtsrd.com | Volume – 1 | Issue – 6 | Sep-Oct 2017 Page: 251
International Journal of Trend in Scientific Research and Development (IJTSRD) ISSN: 2456-6470 Observation Table No. II Table2: Sampling point variation in Pre Monsoon Season (Summer) Parameters S1 pH S2 6.78 S3 7.73 S4 6.47 S5 6.21 0.8 53 S6 6.10 S7 5.83 WHO limit 6.5 to 8.5 8.40 2.3 0.8 0.7 0.8 0.7 0.6 7 mg/l DO 9.51 31 32 53 58 63 -- BOD 44 87 89 96 102 187 287 -- COD 49 118 151 267 263 268 279 250 mg/l Chloride 12 26 29 27 36 41 43 50 mg/l Nitrate 6 8 8.3 19 21 23 29 200 mg/l Sulphate 14 18 21 36 42 49 56 75 mg/l Calcium Magnesium 5 7 9 13 12 26 31 30 mg/l 33.12 88.91 113.32 86.23 189 321 304 300 mg/l Hardness Observation Table No III: Sampling point variation in Monsoon Season (Summer) Parameters S1 S2 S3 S4 S5 S6 S7 WHO limit 6.5 to 8.5 7.72 9.51 8.23 6.65 7.32 0.79 6.31 5.67 pH 2.41 0.91 0.78 0.65 0.83 0.63 7 mg/l -- DO 10 46 43 48 53 56 69 BOD 46 44 63 83 123 136 143 -- COD 29 65 217 231 236 248 259 250 mg/l Chloride 13 17 18 21 19 26 36 50 mg/l Nitrate 16 21 27 29 31 37 46 200 mg/l Sulphate 21 33 39 48 47 53 68 75 mg/l Calcium Magnesium 9 14 16 15 18 24 28 30 mg/l 23 123.21 128 143.23 163 198 207 300 mg/l Hardness @ IJTSRD | Available Online @ www.ijtsrd.com | Volume – 1 | Issue – 6 | Sep-Oct 2017 Page: 252
International Journal of Trend in Scientific Research and Development (IJTSRD) ISSN: 2456-6470 Observation Table No IV: Sampling Point variation in Post Monsoon Season (Winter) Parameters S1 S2 S3 S4 S5 S6 S7 WHO limit 6.5 to 8.5 9.89 8.64 7.97 6.83 6.67 0.23 47 6.12 5.68 pH 2.1 0.7 0.6 0.3 0.19 0.12 7 mg/l DO 08 42 39 42 51 67 ---- BOD 40 58 67 89 127 187 201 ---- COD 36 152 231 257 263 269 273 250 mg/l Chloride 14 26 37 39 41 46 49 50 mg/l Nitrate 19 20 24 29 34 46 57 200 mg/l Sulphate 23 34 49 70 79 81 87 75 mg/l Calcium Magnesium 11 17 16 19 24 28 29 30 mg/l 30.16 102.44 104.68 124.04 133 147 168 300 mg/l Hardness Graphical presentation of the physic-chemical parameters: 350 321 300 268 250 8.4 200 187 S2 150 S3 S4 100 S5 58 50 49 41 S6 26 23 6.1 0 0.7 0 0 0 0 @ IJTSRD | Available Online @ www.ijtsrd.com | Volume – 1 | Issue – 6 | Sep-Oct 2017 Page: 253
International Journal of Trend in Scientific Research and Development (IJTSRD) ISSN: 2456-6470 1200 1000 800 S6 S5 600 S4 400 S3 S2 200 S1 0 1400 1200 1000 S6 800 S5 S4 600 S3 400 S2 200 S1 0 3.RESULTS AND DISCUSSIONS There is a large range of water quality parameters which can be used to characterize waters. However, some parameters are of special importance and deserve frequent attention. Further, depending upon the objective of characterization of a water body, different suits of parameters may be selected. The water parameters can be determined by both analytically i.e. in laboratory and also in the field while collecting the water sample, and hence the parameters which can be determined in the field are called as the field-parameters. Water samples were collected from Khadkwasla dam to Sangam Bridge during pre monsoon (April - May), monsoon (July - August) and post monsoon (October - November) phase in year 2016. pH is defined as the logarithmic of reciprocal of H+ ion concentration. When hydrogen ion concentration increases, water becomes acidic and pH value reduces. pH measurements are important in medicine, biology, chemistry, agriculture, forestry, food science, environmental science, engineering, chemical engineering water treatment & water purification plants and many other applications oceanography, civil @ IJTSRD | Available Online @ www.ijtsrd.com | Volume – 1 | Issue – 6 | Sep-Oct 2017 Page: 254
International Journal of Trend in Scientific Research and Development (IJTSRD) ISSN: 2456-6470 [14]. Here pH is observed in the range from 8.40 to 5.83 at pre-monsoon season which shows that water is alkaline at first sampling station i.e. Kharakwasla and 5.83 at the sampling station Bund Garden, which shows water is acidic, means H+ ion concentration is increased. But at Monsoon pH is in the range of 5.67 to 9.51 which shows alkalinity at first sampling station, it may be due to collection of water by all the sources. At post Monsoon pH is in the range of 5.68 to 9.89 which proves that water is alkaline at first sampling station. Dissolved oxygen is a relative measure of the amount of oxygen which is dissolved or carried in a water body. Dissolved oxygen levels are depending upon the physical, chemical, and biochemical activities prevailing in the water body. Here the observed values are in the range of 0.6 to 2.41 mg/L at all the season. Dissolved oxygen is important for living organism to mentain their biological processes[15- 16]. In corrosion also it is important factor. The higher concentrations of DO in winter were probably due to the fact hot conditions during winter are more favorable for higher photosynthesis[17]. Good water should have the solubility of oxygen. 7.6 and 7.0 mg/L at 30oC and 35oC respectively[18-19]. Dissolved Oxygen in water is necessary for aerobic biological activities. In the absence of sufficient amount of dissolved oxygen in water, the anaerobic degradation of the pollutants makes the water foul smelling. BOD is a measure of the amount of oxygen required for the Biological Oxidation of the organic matter under aerobic conditions at 20 0c and for a period of 5 Days. Basically BOD is directly related to the extent of pollution of waste water, sewage and industrial effluents[20-21]. Here observed values are in the range of 08 to 69 mg/L. Here, the higher value of BOD observed is 69mg/L, at Moonson session at Bund Garden sampling station. COD is a measure of any kind of oxidisable impurities present in the sewage[22]. COD is a measure of both the biologically oxidisable and biologically inert organic matter present in the sewage sample[23]. Here observed values are between 44 to 287 mg/L. Chlorides are present in all natural waters. Fresh water sources contain chlorides ranging from 100 to 200 mg/L[24, 26]. Here, observed values are in the range of 29 to 279mg/L. Higher values of chlorine indicates the use of water for bathing, washing clothes, use of detergents, etc. The amounts of chloride found in the sample did not exceed the maximum permissible limit i.e. 500 mg/L for drinking water prescribed by WHO[28]. The presence of sulphate has less effect on the taste of water compared to the presence of chloride[25]. The desirable limit of sulphate in drinking water prescribed by ICMR is 200-400 mg/L. For the remaining parameters like calcium magnesium and hardness, the observed values are within the limit of WHO[28]. 4.CONCLUSION It is concluded that the physic-chemical parameters of Mula-Mutha river are within the permissible limit prescribed by WHO except some of the sampling stations for two-three parameters, like chlorides and hardness at pre-monsoon stage. BOD and COD at post monsoon stage. The major sources of pollution of river Mula -Mutha are presence of dissolved salts and carbonates of the surrounding soil, waste from temples, additional flow of domestic waste, industrial waste, and agricultural waste which is mainly organic matter, and other solid waste in to the water. REFERENCES 1)APHA- Standard Methods for the Examination of Water and Waste Water, 20th Ed., APHA, AWWA, WEF. Washington DC, 1998 2)Bhandari N S and Nayal K 2008 E-Journal of Chemistry, 2008, Volume 5, Issue(2), pp342-346 3)Basavaraja, Simpi, S. M., Hiremath, K. N. S. Murthy, K. N. Chandrashekarappa, Anil N. Patel, E.T.Puttiah, (2011), Analysis of Water Quality Using Physico-Chemical Parameters Hosahalli Tank in Shimoga District, Karnataka, India, Global Journal of Science Frontier, Research, 1(3), pp 31-34. 4)Chavan, R. P., Lokhande, R. S., Rajput, S. I., (2005), Monitoring of organic pollutants in Thane creek water, Nature Environment and Pollution Technology, 4(4), pp 633-636. 5)Dey, Kallol, Mohapatra, S. C., Misra, Bidyabati, (2005), Assessment of water quality parameters of the river Brahmani at Rourkela, Journal of Industrial Pollution Control, 21(2), 265-270. 6)Gnana Rani, D. F., Arunkumar, K., Sivakumar, S. R., (2005), Physio-chemical analysis of waste water from cement units, Journal of Industrial Pollution Control, 21(2), 337-340. 7)Gupta, D. P., Sunita and J. P. Saharan, (2009), Physiochemical Analysis of Ground Water of @ IJTSRD | Available Online @ www.ijtsrd.com | Volume – 1 | Issue – 6 | Sep-Oct 2017 Page: 255
International Journal of Trend in Scientific Research and Development (IJTSRD) ISSN: 2456-6470 Selected Area of Kaithal City (Haryana) India, Researcher, 1(2), pp 1-5. 8)Garg D. K, Goyal R. N and Agrawal V. P, Ind. J. Envir.Prot.1990, 10(5), 355-359. 9)Jena, P. K., Mohanty, M, (2005), Processing of liquid effluents of mineral processing industries, Intl Symposium Environ Metallurgical Industries, 11-14 , Bhubaneshwar, pp 193- 212. 10)Karanth, K. R, (1987), Groundwater Assessment Development and Management Tata McGraw Hill publishing company Ltd., New Delhi, pp 725-726. 11)Kataria, H. C., Quershi, H. A., Iqbal, S. A. and Shandilya, A. K, (1996),Assessment of water quality of Kolar reservoir in Bhopal (M.P.). Pollution Research. 15(2), pp 191-193. 12)Kodarkar, M. S., (1992), Methodology for water analysis, physico-chemical, Microbiological Indian Association of Aquatic Biologists Hyderabad, Pub. 2 : pp. 50. 13)Krishnamurthy, R., (1990), Hydro-biological studies of Wohar (Maharashtra State) Environmental Biology, 11(3), 335-343. 14)Manjare, S. A., S. A. Vhanalakar and D. V. Muley, (2010), Analysis of water Quality using Physico-Chemical parameters Tamdalge Tank in Kolhapur District, Maharashtra, International Journal of Advanced Biotechnology and Research, 1(2), pp 115-119. 15)Navneet, Kumar, D. K. Sinha, (2010), Drinking water quality management through correlation studies among various parameters: A case study, International Journal of Environmental Sciences, 1(2), pp 253-259. 16)Pawar, Anusha, C., Nair, Jithender, Kumar, Jadhav, Naresh, Vasundhara, Devi, V., Pawar, Smita, C., (2006), Physico-chemical study of ground work samples from Nacharam Industrial area, Hyderabad, Andhra Pradesh, Journal of Aquatic Biology, 21(1), pp 118-120. 17)Patil. P.N, Sawant. D.V, Deshmukh. R.N Physico- chemical parameters for testing of water – A review International Journal of Environmental Sciences Volume 3 No.3, 2012 1206 18)Premlata, Vikal, (2009), Multivariant analysis of drinking water quality parameters of lake Pichhola in Udaipur, India. Biological Forum, Biological Forum- An International Journal, 1(2), pp 97-102. 19)Quinn, B. F., Syers, J. K., (1978), Surface irrigation of pasture with treated sewage effluent, heavy metal content of sewage effluent, sludge, soil and pasture, New Zealand Journal of Agricultural Research. 21, pp 435-442. 20)Sinha A.K., Singh V. P. and Srivastava K., Physico –chemical studies on river Ganga and its tributaries in Uttar Pradesh –the present status. In pollution and Biomonitoring of Indian Rivers.(ed.) Dr. R.K. Trevedi. ABD publishers, Jaipur. 2000,1- 29 21)S.D. Jadhav, M.S. Jadhav , Water quality evaluation and water quality index of Krishna River near Karad Tahsil, Dist Satara, (M S India) International Journal of Chemical Studies, 2016 Volume 4, Issue 5, Pages: 94-97, P-ISSN2349– 8528 E-ISSN 2321–4902 22)Sharma, Madhvi, Ranga, M. M., Goswami, N. K., (2005), Study of groundwater quality of the marble industrial area of Kishangarh (Ajmer), Rajshthan, Nature Environmental and Pollution Technology, 4(3), pp 419-420. 23)Sarkar M, Banerjee A , Pratim.P and Chakraborty S, J. Indian Chem. Soc., 2006 , 83, 1023-1027. 24)Saravanakumar, K. and R. Ranjith, Kumar, (2011), Analysis of water quality parameters of groundwater near Ambattur industrial area, Tamil Nadu, India, Indian Journal of Science and Technology, 4(5), pp 1732-1736. 25)Sawane, A. P., Puranik, P. G., Bhate, A. M., (2006), Impact of industrial pollution on river Irai, district Chandrapur, with reference to fluctuation in CO2 and pH, Journal of Aquatic Biology, 21(1), pp 105-110. 26)S.D. Jadhav, M.S. Jadhav, Study of Chloride Concentration of Neera River at Pune , July 2017 ( Maharashtra),India., International Journal of Chemical and Life Sciences Vol 6 No.4 , Pp 2025-2028. 27)Trivedi R.K and Goel P.K, Chemical and Biological Methods for Water Pollution Studies, Environmental Publication, India 1986 28)WHO -World Health Organization, Guidelines for drinking water quality-I, Recommendations, 2nd Ed. Geneva Manag Mining Biological and reservoir India, Aurangabad Journal of physicochemical WHO, 1993 @ IJTSRD | Available Online @ www.ijtsrd.com | Volume – 1 | Issue – 6 | Sep-Oct 2017 Page: 256