Download
1 / 7
70 likes | 75 Views
This work presents a study on the comparison between Destructive Compressive test and Non destructive testing techniques Schmidt Rebound Hammer . Tests moisture content, Sieve analysis, particle density for aggregate and cement paste, bulk density, standard consistency of cement, slump test were performed on both the aggregate and cement to compare their accuracy of both methods and test the quality of the material to be used for concrete casting and estimating the strength of concrete. Seventy samples cubes of 150 x 150 x 150mm were prepared using mix designs of 1 2 4 with a constant w c ratio of 0.45 and were tested at 7, 14, 21 and 28 days respectively. From the results, the rebound number increased from an average of 12 for 7days to an average rebound number of 17.7 for 28days which is similar to the increment in compressive strength from an average of 24.3 for 7days to an average of 32 for 28days which show that the increment in the strength is uniform but 5 difference in value obtained. The slump test was between 62 78mm. From the results of the analysis, it was observed that the strength obtained from destructive process conformed to targeted mix value, whereas that of the Rebound hammer was below these values. Statistical analysis of the results obtained showed that 5 difference exists between the results obtained from the two methods. Hence, there was no significant difference between the means of the two methods for both mixes at a 0.05 level of significance. Non destructive Testing is observed to be more economical as it required no electricity and can also be used directly in the field. Onyeka, F. C | Mama, B. O "Comparative Analysis of Destructive and Non-Destructive Testing Method of Concrete Strength using Compressive and Rebound Harmmer Testing Method" Published in International Journal of Trend in Scientific Research and Development (ijtsrd), ISSN: 2456-6470, Volume-4 | Issue-1 , December 2019, URL: https://www.ijtsrd.com/papers/ijtsrd29389.pdf Paper URL: https://www.ijtsrd.com/engineering/civil-engineering/29389/comparative-analysis-of-destructive-and-non-destructive-testing-method-of-concrete-strength-using-compressive-and-rebound-harmmer-testing-method/onyeka-f-c<br>

E N D
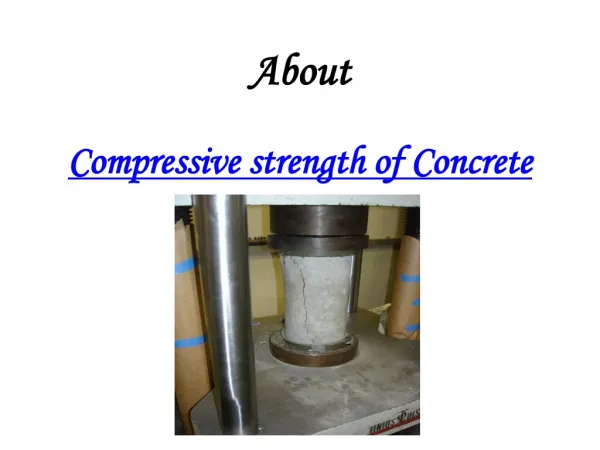
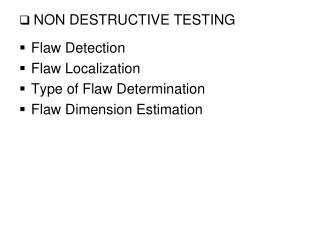
International Journal of Trend in Scientific Research and Development (IJTSRD) Volume 4 Issue 1, December 2019 Available Online: www.ijtsrd.com e-ISSN: 2456 – 6470 Comparative Analysis of Destructive and Non-Destructive Testing Method of Concrete Strength using Compressive and Rebound Harmmer Testing Method Onyeka, F. C1; Mama, B. O2 1Department of Civil Engineering, Edo University, Iyamho, Edo State, Nigeria 2Department of Civil Engineering, University of Nigeria, Nsukka, Nigeria ABSTRACT This work presents a study on the comparison between Destructive (Compressive test) and Non-destructive testing techniques (Schmidt Rebound Hammer). Tests (moisture content, Sieve analysis, particle density for aggregate and cement paste, bulk density, standard consistency of cement, slump test) were performed on both the aggregate and cement to compare their accuracy of both methods and test the quality of the material to be used for concrete casting and estimating the strength of concrete. Seventy samples (cubes of 150 x 150 x 150mm) were prepared using mix designs of 1:2:4 with a constant w/c ratio of 0.45 and were tested at 7, 14, 21 and 28 days respectively. From the results, the rebound number increased from an average of 12 for 7days to an average rebound number of 17.7 for 28days which is similar to the increment in compressive strength from an average of 24.3 for 7days to an average of 32 for 28days which show that the increment in the strength is uniform but 5% difference in value obtained. The slump test was between 62 - 78mm. From the results of the analysis, it was observed that the strength obtained from destructive process conformed to targeted mix value, whereas that of the Rebound hammer was below these values. Statistical analysis of the results obtained showed that 5% difference exists between the results obtained from the two methods. Hence, there was no significant difference between the means of the two methods for both mixes at a 0.05 level of significance. Non-destructive Testing is observed to be more economical as it required no electricity and can also be used directly in the field. KEYWORDS: Concrete, Non-Destructive Testing, Compressive Strength, Rebound Hammer, Destructive Testing method 1.INTRODUCTION Non-destructive test (NDT) is the way of obtaining the information about the state, properties of materials without interfering with the attributes of the object or structure. They are those tests that do not alter the concrete and after conducting they do not destroy the concrete. Non-destructive test is a method of testing existing concrete structures to assess the strength and durability of concrete structure. In the non-destructive method of testing, without loading the specimen to failure (i.e. Without destructing the concrete) we can measure the strength of concrete. In 1984, Ernest Schmidt, a Swiss engineer developed a device for testing concrete based on the rebound principle (Malhotra, 1976, 2004). Now days, this method has become a part of quality control process. This method of testing also helps us to investigate crack depth, micro cracks and deterioration of concrete (Rangaraju, 2003). It can also be seen as the cause of inspecting, testing or evaluating materials, component assemblies without destroying the serviceability of the part or system (Workman and O. Moore, 2012). Generally, the purpose of How to cite this paper: Onyeka, F. C | Mama, B. O "Comparative Analysis of Destructive and Non-Destructive Testing Method of Concrete Strength using Compressive and Rebound Harmmer Testing Method" Published in International Journal of Trend in Scientific Research and Development (ijtsrd), ISSN: 2456- 6470, Volume-4 | Issue-1, December 2019, pp.1-7, URL: https://www.ijtsrd.com/papers/ijtsrd29 389.pdf Copyright © 2019 by author(s) and International Journal of Trend in Scientific Research and Development Journal. This is an Open Access article distributed under the terms of the Creative Commons Attribution License (CC (http://creativecommons.org/licenses/by /4.0) IJTSRD29389 BY 4.0) non-destructive testing is to determine the quality and integrity of materials, components or assemblies without affecting the ability to perform their intended functions. In the other hand, Destructive tests are usually carried out either on test specimens made for that purpose or may be made on one specimen taken as representative of several similar items. They are done in laboratories, workshops or training centre and can be chemical or mechanical in nature (Rangaraju, 2003). Destructive tests are usually quantitative measurements of load for failure, significant distortion or damage, or life to failure under given load and environmental conditions. They are carried out to the specimen’s failure, in order to understand behaves under different loads which consequently yield numerical data useful for design purposes or for establishing standards or specifications. Destructive testing is a testing technique in which the application is made to be failing in an uncontrolled manner to test the robustness of the application and also to find the point of failure. Destructive testing is performed under the most severe operating conditions and it is continued until @ IJTSRD | Unique Paper ID – IJTSRD29389 | Volume – 4 | Issue – 1 | November-December 2019 Page 1
International Journal of Trend in Scientific Research and Development (IJTSRD) @ www.ijtsrd.com eISSN: 2456-6470 the application breaks. Destructive tests are widely applied to study mechanical properties and integrity of concrete structures (Rauin Drarajah, 1997; Naza Man et al.., 1997; Proverbio and Venture, 2005; IAEC, 2005). Catastrophic strength failure has occurred in some structures as a result of some concrete made of low strength ductile materials and some made of high strength but low toughness materials. This has led to more demand levels and to increase the use of destructive and non-destructive test in manufacture. These defects can be the result of initial flows in the materials, production deficiencies and service condition, e.g. fatigue cracks or stress corrosion cracks. It is as a result of these that the need to test the in-place strength of concrete arises. In this research work, the rebound hammer method and compressive strength are used to test the strength of a particular concrete. This work also addresses the question “which method is cheaper” which method is more accurate”. This research work is carried out in order to determine the in-place strength of concrete using the rebound hammer method and the compressive strength. The research is therefore imperative as it tries to compare destructive and non-destructive testing methods in order to deduce which of the methods gives more features on the characteristics of concretes. A comparison of the two methods above is done in order to identify the best procedure to predict strength and durability of concrete. Also to identify the most economical and reliable method to be applied. The objectives of this research work is to determine a method between destructive and non-destructive test that can be more suitable for estimating the strength of concrete using Rebound hammer method and Compressive strength. To identify the potential and limitations of the various methods in investigating the strength of concrete and to identify the most economical method for investigating the strength of concrete. This was done by grouping the test specimen (concrete cubes of 150mm by 150mm by 150mm) into 100 to compare the result among the NDT techniques against the normal testing methods of cube crushing (destructive test). 2.MATERIALS AND METHODS The materials that were used in this research work are River uncrushed fine aggregate collected From a sand depot at Ikwuano L.G.A Abia State, crushed coarse aggregate of 40mm 3.1.Result Moisture Content of Aggregate maximum size collected from Ahiaeke Ndume Umuahia North L.A.G, Abia state and a 42.5 cement grade (Ordinary Portland Cement), this includes aggregate classification test. Cubes with a mix ration 1:1.5:2, 1:2:4, 1:3:6, was cast, cured and crushed with the comprehensive strength result as a basis for testing concrete non-destructively using rebound hammer methods. 2.1.Laboratory Procedures The test that was carried out include moisture content for both fine and coarse aggregate sieve analysis for fine aggregate, particle density for fine and coarse, bulk density, slump test, strength test (Rebound hammer and compressive strength)for hardened at various ages, and standard consistency (setting time of cement) In addition to the tests, mix design was also carried out. 2.2.Tests on hardened concrete The tests carried out on the hardened concrete were the Rebound Hammer test and the cube compressive test. Before the compressive tests were carried out, the cubes were subjected to testing using the Rebound hammer on the specimen. A total of 10 readings was taken on each test surface as recommended by ASTM C805 and the average rebound number was then obtained. Each cube was then placed in the testing machine in between two metal plates. Having properly positioned each cube, the load was gradually applied without shock until the cube failed and the loads at failure were recorded for each sample. The load at failure was then divided by the effective area of the cube in square millimetres to obtain the compressive strength of the cube. 3.PRESENTATION, ANALYSIS OF RESULT AND DISCUSSION The various results obtained from table 1 – table 5 showed that the material for concrete production conformed to EN1881 and ASTM 33 standard for testing material readily for concrete production. These results serve as bases for the mix design for the work as shown below. The mix design is then carried out using a characteristic mean strength of 20N/mm2. Maximum aggregate size 20mm, maximum water/cement ratio 0.5, workability 30-60mm slump, exposure condition, mild, minimum cement content 350kg/m3, specific gravity of cement, coarse and fine aggregate (3.15, 2.76, 2.46) and that of saw dust 0.68. Table 1a: Moisture Content of Fine Aggregate TEST DATA Mass of container M1(g) Mass of wet sample + container M2(g) Mass of dry sample + container M3(g) Mass of moisture M2- M3)(g) Mass of dry sample (g) Moisture content (%) Average moisture content (%) SAMPLE 1 SAMPLE 2 31.2 341.9 332.1 9.8 300.9 3.3 3.3 33.0 326 317.0 9.0 284 3.2 @ IJTSRD | Unique Paper ID – IJTSRD29389 | Volume – 4 | Issue – 1 | November-December 2019 Page 2
International Journal of Trend in Scientific Research and Development (IJTSRD) @ www.ijtsrd.com eISSN: 2456-6470 Table 1b Moisture Content of Coarse Aggregate TEST DATA Mass of container M1(g) Mass of wet sample + container M2(g) Mass of dry sample + container M3(g) Mass of moisture M2- M3)(g) Mass of dry sample (g) Moisture content (%) Average moisture content (%) SAMPLE 1 SAMPLE 2 31.2 590.89 580.4 10.4 549.2 1.9 1.8 25.5 490.6 483.1 7.5 457.6 1.6 3.2.Sieve Analysis on Fine and coarse Aggregates: The following results were obtained from the sieve analysis carried out on both fine aggregate, and coarse aggregate on dry mass process. 100 91.76 90 PERCENTAGE PASSING 80 75.62 70 60 59.72 59.32 50 40 30 20 10 2.12 0 0.22 Figure 1: Particle Size Graph on a Fine Sand Figure 2: Particle Size Graph Coarse Aggregate 3.3.Specific Gravity of Aggregate The specific gravity of the various which was carried out at room temp thus yielding the following results. Table 2a: Specific Gravity of Sand DESCRIPTION Mass of vessel (g) Mass of vessel + sample (g) Mass of sample (A) (g) Mass of vessel + sample + water (B) (g) Mass of vessel + water (C) (g) P= SAMPLE A 618.7 1054.3 435.6 1749.0 1493.0 SAMPLE B 618.7 1023.9 405.2 1704.9 1493.0 = 2.10 = 2.42 Average specific gravity 2.26 @ IJTSRD | Unique Paper ID – IJTSRD29389 | Volume – 4 | Issue – 1 | November-December 2019 Page 3
International Journal of Trend in Scientific Research and Development (IJTSRD) @ www.ijtsrd.com eISSN: 2456-6470 Table 2b: Specific Gravity of Coarse Aggregate DESCRIPTION Mass of Air Dried Sample (A) Mass of Basket + Sample in Water (B)(g) Mass of Basket in Water (C) (g) SAMPLE A 2266.2 1566.7 244.6 SAMPLE B 2375 1754.8 246.7 P= = 2.40 = 2.74 Average Specific Gravity 2.57 3.4.Bulk Density of Aggregate Table 3a: Bulk Density of fine Aggregate DESCRIPTION Weight of Mould + sample (g) Weight of mould (g) Volume of mould (Cm3) Bulk density (g/Cm3) Un-compacted Compacted 16140 6420 7226.6 1.34 17315 6420 7226.6 1.51 Table 3b: Bulk Density of coarse aggregate DESCRIPTION Weight of Mould + sample (g) Weight of mould (g) Volume of mould (Cm3) Bulk density(g/cm3) Un-compacted Compacted 16590 6420 7226.6 1.41 18155 6420 7226.6 1.62 3.5.Specific gravity of Ibeto Cement: The specific gravity was determined on relative paraffin value for the OPC cement (IBETO) at room temperature to obtain the results below: Table 4: Specific Gravity of IBETO Cement DESCRIPTION Mass of empty bottle(W1) (g) Mass of bottle +cement (W2) (g) Mass of bottle +cement + kerosene (W3) Mass of bottle +kerosene (W4) (g) Mass of bottle + water (W5) (g) SAMPLE A SAMPLE B 28.0 50.1 85.0 68.4 77.8 27.6 49.5 85.4 68.0 78.4 SP of kerosene= = 0.81 0.80 SP of Cement = 3.06 3.13 Average specific gravity 3.09 3.6.Consistency of Cement Table 5:Setting Time and Fineness of Dangote Cement DESCRIPTION Result Weight of cement(g) 400g Weight of water(g) 103g Initial setting time 60mins Final setting time 90mins Fineness of cement using BS sieve NO. 170 Weight of sample 100g Fineness of cement 2% Limit of specification Remark Minimun200g Minimum50g Minimum 45 mins Maximum 600mins Good Good Good Good Minimum of 50g Maximum 10% Good Good Table 6: Quantity of Constituent to Normal Concrete for Experimental Mix Fine aggregate (kg/M3) 674.040 70.1837 Coarse Aggregate (Kg/M3) 1134.360 118.114 Mould Volume M3 Cement kg/M3 Water litres Cube meter Cube mould+ 10% 1 383.000 39.8794 193.000 20.096 0.104124 @ IJTSRD | Unique Paper ID – IJTSRD29389 | Volume – 4 | Issue – 1 | November-December 2019 Page 4
International Journal of Trend in Scientific Research and Development (IJTSRD) @ www.ijtsrd.com eISSN: 2456-6470 3.7.Analysis Result on Destructive Compressive and Rebound Number of Non-Destructive Test. COMPRESIVE 7 DAYS 30 25 20 15 10 5 0 SAMPLE 1 SAMPLE 2 SAMPLE 3 Figure 3: Compressive for destructive and rebound number 7 day curing. Table 7: ANOVA Analysis for 7 days strength From figure 3 and table 7, the various compressive strength had an average strength of (21.3 28.4 and 23.1) for destructive testing while (12.7 11.2 and 10.9) were rebound values of the Result from above Mat Lab 2 way ANOVA test below shown below with the following data; different within column 49.877, between Row5.966; Fcal within = 14.52 and P=0.1956 Degree of freedom D1=3-1= 2, D2= 32-2 = 30 F tabulated = 3.32. The Fcal fall at the critical region showing mean difference in strength at the 5% level of significance. Also the strength had a small p value which indicates significance in different strength. COMPRESIVE 14 DAYS 40 20 0 SAMPLE 1 SAMPLE 2 SAMPLE 3 DESTRUCTIVE COMPRESSIVE Figure 4: Compressive for destructive and rebound number 14 day curing Table 8: ANOVA Analysis for 14 days test result REBOUND NUMBER Column1 From figure 4 and 8 the various compressive strength had average strength of (28.9 30.7 and 28.0) for destructive test while (12.6 17.1 and 15.5) were rebound values of the Result from above Mat Lab 2 way ANOVA test below shown below with the following data; diff within column 58.397, between Row50.448 ; Fcalwithin = 12.22 and P=0.0007 Degree of freedom D1=3-1= 2, D2= 32-2 = 30 F tabulated = 3.32. The Fcal fall at the critical region showing mean difference in strength at 5% level of significant. Also the strength had small p values which indicate significance in different strength. @ IJTSRD | Unique Paper ID – IJTSRD29389 | Volume – 4 | Issue – 1 | November-December 2019 Page 5
International Journal of Trend in Scientific Research and Development (IJTSRD) @ www.ijtsrd.com eISSN: 2456-6470 Figure 5: Compressive for destructive and rebound number 21 day curing Table 9: ANOVA Analysis for 21 days test result From figure 5 and 9, the various compressive strength had an average strength of (32.4 29.3 and 33.3) for destructive test which meet up with the designed strength while (15.5 15.9 and 14) were rebound values the Result from above Mat Lab 2 way ANOVA test below shown below with the following data; different within column 79.03, between Row7.56; Fcal within = 10.24, Fcal between rows: 0.98 and P=0 and 0.3297 Degree of freedom D1=3-1= 2, D2= 32-2 = 30 F tabulated = 3.32. The Fcal within the data fall at the critical region showing mean difference in strength at the 5% level of significance but Fcal between rows shows no significant difference. Also the strength had a small p value which indicates significance in different strength. COMPRESIVE 28 DAYS 40 20 0 SAMPLE 1 SAMPLE 2 SAMPLE 3 Fig 6: Compressive for destructive and rebound number 28 day curing. Table10: ANOVA Analysis for 28 days test result. From figure 6 and table 10, the various compressive strength had an average strength of (27.6 35.6 and 32.9) for destructive test which exceeded the designed strength while (16.8 16.3 and 18.3) were rebound below design values. The Result from above Mat Lab 2 way ANOVA test below shown below with the following data; different within column 63.54, between Row 9.89; Fcal within = 9.72, Fcal between rows: 1.51 and P=0 and 0.224 Degree of freedom D1=3-1= 2, D2= 32-2 = 30 F tabulated = 3.32. The Fcal within the data fall in the critical region showing mean difference in strength at the 5% level of significance but Fcal between rows shows no significant difference. Also the strength had small p values which indicate significance in different strength. @ IJTSRD | Unique Paper ID – IJTSRD29389 | Volume – 4 | Issue – 1 | November-December 2019 Page 6
International Journal of Trend in Scientific Research and Development (IJTSRD) @ www.ijtsrd.com eISSN: 2456-6470 4.CONCLUSION /RECOMMENDADATION From the result shown and analyzed for the null hypothesis H0(there is no mean different between the compressive strength values obtained by destructive test and the value obtained from rebound number) draws the conclusion that at 5% significant level, there is a mean difference in the values obtained from rebound number and destructive strength for curing period of 7-28 days thus we reject the null hypothesis and accept H1 that the two process are different and had no correlated value at 5% significant level. Nevertheless, there was no significant value within the values of rebound number from 14-28 days curing period. The strength obtained by destructive process conformed to the targeted mix value whereas that of the rebound number was below these values. From the result of the analysis, the rebound hammer increased from an average of 12 per 7days to an average rebound number of 17.7 for 28days which is similar to the increment in compressive strength from average of 24.3 for 7days to average of 32 for 28days which show that the increment in the strength is uniform but 5% difference in value obtained. Non-Destructive Testing is observed to be more economical as it required no electricity and can also be used directly in the field. It is therefore recommended that both methods be used but not as a substitute for the other as both do not give exactly the same result. REFERENCES [1]ACI Committee (1998). Non-destructive test methods for evaluation of concrete in structures. ACI 228.2R. American concrete institute, Farmington Hills, MI. [3]ASTM (2002a). Standard test method for pulse velocity through concrete. ASTM C597, ASTM International, West Conshohocken PA. [4]ASTM (2004a). Standard practice for estimating concrete strength by maturity method, ASTM C1074. ASTM International, West Conshohocken, PA. [5]Carino N. J. (1944). Non-destructive testing of concrete, history and challenges. In concrete technology past, present and future. Proceedings of U. Mohan Malhotra Symposium, ACI SP-144, Pp, 623-678. American concrete institute, Fermington Hills, MI. [6]Malhotra V and Carette G. (2004). Penetration resistance methods. In V. Malhotra and N. Carino handbook on non-destructive testing of concrete. pp 10-23. New York: CRC press. [7]Malhotra V. M. (2004). Surface hardness methods in handbook on nondestructive testing of concrete, 2nd ed., Malhotra V. M. and Carino N. J. Eds. CRC press, Bocarato, FL. [8]Malhotra, U. M. (1976). Testing hardened concrete, Nondestructive methods, ACI Monograph No. 9. IOWA state University press, Ames. [9]Proverbio, E., and Venture, V. (2005). Reliability of Non-destructive test for concrete strength’ 10 DBMC lyou 17-20 [10]Rangaraju P.R. (2003). “Development of Some Performance-Based Material Specifications for High- Performance Concrete Pavement,” Transportation ResearchRecord, No. 1834, pp. 69-76. [11]Ravingrarajah, R. S. (1997). “Strength evaluation of high-strength concrete by ultrasonic pulse velocity method” NDT Int., 30, 4. [12]Workman G., and O-Moore P. (2012). Nondestructive testing handbook 10: over-view Columbus: American Society of Nondestructive Testing. [2]ACI Committee (2003). In-place methods to estimate concrete strength, ACI 228.1R. American concrete institute, Fermington Hills, MI. @ IJTSRD | Unique Paper ID – IJTSRD29389 | Volume – 4 | Issue – 1 | November-December 2019 Page 7