Download
1 / 23
230 likes | 346 Views
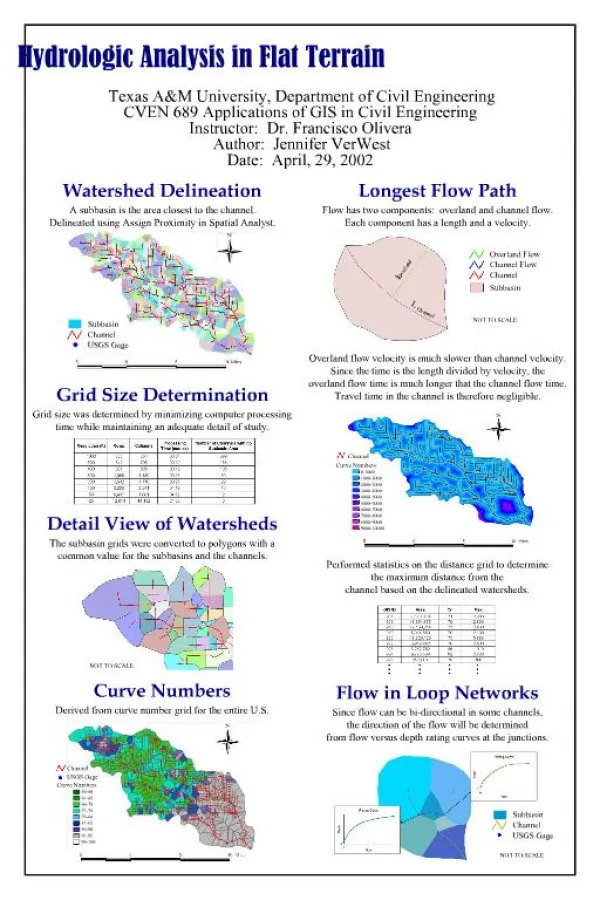
Hydrologic Analysis with GIS. Eric Anderson 3/18/03. Outline. DTMs (Digital Terrain Models) Hydrologic Modeling Procedures Filling Sinks Determining Flow Direction/Accumulation Developing CN Numbers Potential Runoff Map. DTMs. Grid Overlay

E N D
Hydrologic Analysis with GIS Eric Anderson 3/18/03
Outline DTMs (Digital Terrain Models) Hydrologic Modeling Procedures Filling Sinks Determining Flow Direction/Accumulation Developing CN Numbers Potential Runoff Map
DTMs • Grid Overlay • Each cell assigned a value (elevation, land cover, etc.)
Raster Tools in ArcMap • Spatial Analyst – Raster processing extension in ArcMap • Very Powerful Tool • Allows slope, aspect, azimuth, classifications, and other raster manipulations
Deriving Attributes from Rasters • Using a DEM • Slope–rate of elevation change expressed as percentage or degrees • Aspect—compass direction of the steepest slope • END OF THE REVIEW
Preprocessing DEMs • DEMs must be preprocessed to eliminate inherent errors • Sinks • Most common error is a sink • Places where water might drain, but are disconnected with the entire drainage system
Sink Example 100 100 100 100 100 100 97 96 95 100 100 98 99 100 100 100 100 100 100 101
Flow Direction and Accumulation • Basis of most all GIS hydrological analysis • Once flow direction is known it is possible to determine how many cells flow into a given cell • Basis of watershed delineation and stream networking
12 13 13 11 10 10 8 10 9 Flow Direction and Accumulation • SLOPE • Slope of each cell based on its eight neighbors • Largest slope will be assigned to the center cell
100 100 100 100 94 97 96 95 100 100 100 98 99 100 100 100 100 100 100 101 Flow Direction and Accumulation • FLOW DIRECTION GRID • Determine flow direction with slope grid • If one cell’s slope is lower than its neighbor, flow will be in the direction of that cell
Flow Direction and Accumulation • FLOW ACCUMULATION • Trace backwards up the flow direction grid and determine the number of cells flowing into each cell • Accumulated flow is the number of cells flowing into each cell • generate a grid to represent the total number of cells flowing into each cell • Cells that have high accumulation are designated as stream channels
Flow Accumulation Surface 0 0 0 0 18 0 3 8 15 0 0 2 2 0 0 0 0 0 0 0
Predictive Equations • Runoff Availability Equation • Can be used to predict the amount of water that will become runoff given a specific rainfall event • For example, how much runoff can be expected if there is an inch of rain over a clay soil with dense vegetation • Based on soil characteristics and land cover Q = (sqrt(p – 0.2 * (1000/CN – 10))) / (p + 0.8 * (1000/CN – 10)) Where: Q = total water available for runoff p = precipitation CN = curve number
Runoff Availability Equation • Equation based on the CN number • CN number based on soil and land cover characteristics—both easily available in raster or vector format for GIS • CN values range from 0-100 (like a percentage) • Note: concrete has a CN value of nearly 100
Combining Land Cover and Hydrologic Soil Group Layers—Raster Calculator
Combine Land Cover and Hydrologic Soil Group Layers • Enter in Raster Calculator • [Hydrologic Soil Group].Combine( { [Land Use and Cover] } ) • Raster calculator will create a new grid • Values in the new grid represent zones of unique combinations of values in the input grids • Each of these soil/landcover combinations is then assigned a value of Curve runoff based on a table you can get from the NRCS
Plug in CN Grid and Precipitation Grid into Available Runoff Equation • Original Equation • Q = (sqrt(p – 0.2 * (1000/CN – 10))) / (p + 0.8 * (1000/CN – 10)) • Raster Calculator Operation • ( ([Precipitation] - 0.2.AsGrid) * ((1000.AsGrid / [CN]) - 10.asgrid)).sqr / ( ([Precipitation] + 0.8.AsGrid) * ((1000.AsGrid /[CN]) - 10.AsGrid))