Download
1 / 14
140 likes | 254 Views
Quantification of anthropogenic emissions from an urban region: First results of time-integrated flask samples from the Indianapolis Flux Project ( INFLUX). Jocelyn Turnbull , Colm Sweeney, Doug Guenther, Pieter Tans , NOAA/ESRL and CIRES, University of Colorado

E N D
Quantification of anthropogenic emissions from an urban region: First results of time-integrated flask samples from the Indianapolis Flux Project (INFLUX) Jocelyn Turnbull, Colm Sweeney, Doug Guenther, Pieter Tans, NOAA/ESRL and CIRES, University of Colorado Natasha Miles, Scott Richardson, Thomas Lauvaux, Kenneth Davis, Pennsylvania State University Paul Shepson, Obie Cambaliza, Purdue University Kevin Gurney, Arizona State University Scott Lehman, INSTAAR, University of Colorado NOAA/ESRL Carbon Cycle Group, INSTAAR Isotope and 14C Lab Staff
INFLUX: Indianapolis Flux ProjectDevelop and test techniques/approaches for measurement of urban-scale greenhouse gas emission fluxes – top-down and bottom-up • Aircraft-based measurements ~biweekly flights • In situ and flasks • Driving tours ~monthly • In situ and flasks • Tower-based measurements – 12 towers • In situ - CO2/CO/CH4 • Flasks – 52 species and isotopes Data analysis and modeling Mass balance approach WRF-CHEM inversions Bottom-up inventories Vulcan 0.1° for US Hestia block level for Indianapolis
INFLUX tower flask sampling • New integrated flask sampling system • First flask measurements
Why use time-integrated flask samples? In urban regions, can have substantial variability in mixing ratios – integrated samples reduce some of this noise Match atmospheric sampling with the ~1 hour time step of regional models and meteorological data Keep integrating time short enough that meteorology is consistent INFLUX tower 1, 2011-04-09 20:00-21:00 UTC
Integrated flask sampling Dryer/integrater package Integrating compressor package Portable flask package valve filter pressure relief valve 0-1L flow controller pressure sensor water trap filter pump pump vent valve fast flush valve integrating volume (15L) • Sample collected over 1 hour • Mix 1 hour of air by flowing through a large mixing volume • Vary flow rate during filling to obtain close to linear mixture • Collect air into 2 PFP flasks for measurement
Integrated flask sampling validation Hourly averaged continuous – integrated flask CO2 in situ – flask difference 0.01±0.09 ppm For comparison: LEF 396 m in situ vs grab flask samples (2006-2011) in situ – flask difference 0.03±0.38 ppm
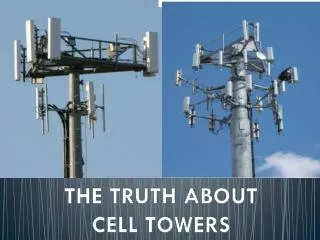
INFLUX: Tower flask results Flask samples collected only when Tower 2 is downwind Tower 1 is always upwind, background station (Criteria met 25% of days) Towers are 120-150m tall cell phone towers Prevailing wind
CO2 enhancements across Indianapolis Tower 2 (downwind) - Tower 1 (upwind)
Enhancements across Indianapolis Strong enhancements in most anthropogenic species
D14CO2 D14CO2 and fossil fuel CO2 D14CO2 is lower at Tower 2 – 14C-free CO2ff decreases D14CO2 CO2obs (Δobs -Δbg) CO2r (Δr -Δbg) CO2ff= Δff -Δbg Δff -Δbg CO2ff CO2ff enhanced at Tower 2
Contributions to CO2 enhancement Flask samples from Dec 2010 – Feb 2011 Slope = 1.1 ± 0.2 ppm/ppm 1:1 line (if DCO2all due to CO2ff) Indiana has 10% bio-ethanol in gasoline – expect DCO27-10% higher than DCO2ff CO2ff and bio-ethanol explain all of DCO2 in winter No significant respiration/photosynthesis contribution
Correlation with CO and benzene Benzene:CO2ff 12±3 ppt/ppm CO:CO2ff 11±3 ppb/ppm Emission ratios are ~20% lower than observed in other US cities Large power plant contributes 30% of Indy CO2ff = lower emission ratios?
Summary • INFLUX towers use a new time-integrated flask sampling system to collect samples averaged over a 1 hour period • Tower sampling is designed to capture both upwind (background) and downwind signals • Strong enhancements in anthropogenic species across the urban region • In winter in Indianapolis, the CO2 enhancement appears to be entirely due to CO2ff and bio-ethanol (there is no apparent photosynthesis/respiration signal) • Reasonable correlations of CO2ff with combustion tracers such as CO and benzene, with emission ratios slightly lower than Western US cities, likely due to influence of power plant • Correlations with other species (e.g. halocarbons) also seen
INFLUX: Indianapolis Flux ProjectDevelop and test techniques/approaches for measurement of urban-scale greenhouse gas emission fluxes – top-down and bottom-up • Opportunities for Collaboration • We welcome collaborators to enhance and expand the INFLUX effort.Possibilities include: • Enhanced atmospheric sampling • 14CO2 /flask measurements • In situ CO measurements • Measurement from vehicles • Other species and isotopes • Atmospheric transport will be a primary source of uncertainty in our final results: • wind profiler (4Km) • Airborne doppler profiler • Radiosonde measurements • Remote Sensing • GOSAT (CO2, CH4), MOPITT (CO) • MODIS, LANDSAT (Biosphere),AVIRIS (IR emissions), FTIR • New Methods • Inverse Modeling • Multiple bottom-up data streams • New measurement techniques and species • Aircraft-based measurements – biweekly flights • Driving tours - monthly • Tower-based measurements – 12 towers • In situ - CO2/CO/CH4 • Flasks – 40 species and isotopes Data analysis and modeling Mass balance approach WRF-CHEM inversions Bottom-up inventories Vulcan 0.1° for US Hestia block level for Indianapolis