Download
1 / 42
420 likes | 527 Views
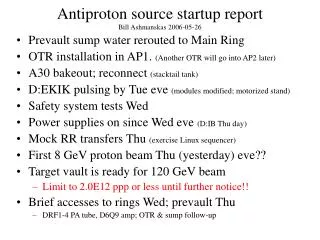
AP2 line BPM system Bill Ashmanskas, Sten Hansen, Terry Kiper, Dave Peterson, 2005-09-21. Background. AP2 line 275 m long, travels from target to Debuncher D p/p 4% (at end of line) Particles per pulse ~ 10 10 at end of line, ~ 10 11 earlier in line

E N D
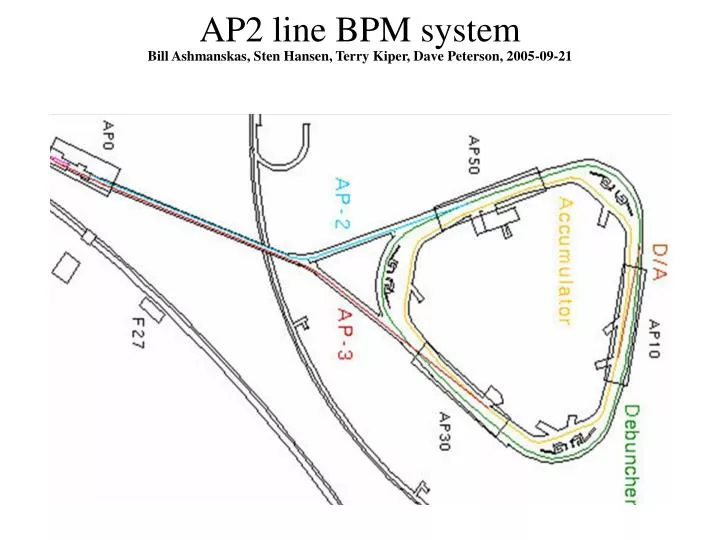
AP2 line BPM systemBill Ashmanskas, Sten Hansen, Terry Kiper, Dave Peterson, 2005-09-21
Background • AP2 line 275 m long, travels from target to Debuncher • Dp/p 4% (at end of line) • Particles per pulse ~ 1010 at end of line, ~ 1011 earlier in line • ~ 108 antiprotons reach Debuncher every ~ 2 seconds • 1.5 ms bunch train, bunched at 53.1 MHz • before amplification, signals while stacking range from about -19 dBm (30 mV) upstream to about -35 dBm (4 mV) dnstream • so we amplify downstream signals 20dB in tunnel • Reverse proton signals range from -50 dBm (1 mV) upstream to -23 dBm (20 mV) downstream (before downstream amplifiers) • maybe we should have amplified upstream, too?
Motivation • Simulations by V. Lebedev et al. indicate that ~ 50% more flux into Debuncher may be possible with well understood optics • Would like to use AP2 line BPMs • to measure optics vs. Dp/p for reverse protons • to correct orbit using reverse protons • to monitor orbit drift and intensities while stacking
History • Legacy AP2 BPM readout did not provide useful data: • signals much smaller than other beamlines’ 53 MHz signals • crosstalk from Debuncher injection kicker • Kicker crosstalk looked pretty severe on oscilloscope • see http://www-bd.fnal.gov/cgi-mach/machlog.pl?nb=pbar03&page=318 • But scope data looked OK offline with narrowband processing • Added BPF before scope to reduce dynamic range needed • (Re)connected existing 20 dB amplifiers to make interfering kicker signal less important • Got ~ 1 mm resolution with scopes – good enough to be useful • Decided to build boards that do signal processing equivalent to what we did with scopes – less clutter, easier readout, less costly
Blue = envelope read from new BPM board Red = raw BPM signal (scope) Green = BPM signal after bandpass filter (scope)
We built something different from the echotek solution because … • Modest demands — only 53 MHz needed • We wanted to control the details, since we weren’t sure how much tinkering would be needed to make the system work • Didn’t have legacy system already working, to help specify upgrade • I spent enough time with CDF trigger to learn to hate VxWorks • Substantially reduced infrastructure cost appealed to us • Gives us a toolkit for other ad-hoc projects • It was much more fun to do it this way • Anyway, the resolution is 100 mm in the lab. • We think, some rainy day, we ought to be able to push it to < 50 mm
Simplified block diagram LO I 5 MHz LPF 53.1 MHz quadrature demodulator 65 MHz LPF RF BPM signal Q 5 MHz LPF TI MSP430 10 bit dual ADC 26.5 MHz FPGA TCP/IP Java OAC
Misc features • NIM module, 4 type N inputs, 2 BPMs • Can lock to external RF or 10 MHz – or not • 10 bit sampling of IF I and Q waveforms • 44dB adjustable gain in demodulator chip • Diagnostic DAC can drive (via analog switches) each input up to about ¼ full scale (at maximum input gain); also drives FP lemo • 32 MB SDRAM available (e.g. data capture), but not used now • Debug/test via USB console or telnet • MSP430F149, programmed in C, provides command interface • WIZnet 1” x 2” daughtercard provides TCP/IP stack • Nearly all processing done in Altera Cyclone 1C6Q240 FPGA • Remote FPGA + CPU update has been demonstrated (but not yet fully implemented in the field) • Single network connection reads out ~ 10 boards • Simple I/O protocol for remote register access (see next page)
Java program by Jim Budlong (analogous to existing Debuncher BPM program)
N.B. chnl 721 is broken in tunnel
Response • Board has 44 dB variable attenuation in IQ demodulator chip • At ¾ full scale, max gain, signal 5 mV peak (-36 dBm) • (84/2) x 384 x 2 32000 counts intensity reading • (sample 26.5 MHz, +511 counts FS, A+B chnls) • A+B rms/mean 0.09% (using board’s own DAC as source) • AB / A+B rms 0.09% 90 (70) mm for 100 (75) mm BPM • Using min gain, ¾ FS, signal 0.5 V peak (+7 dBm) • A+B rms/mean 0.11%, AB / A+B rms 0.11%
Response • Using AWG in instrumentation area, 24 dB atten, 83% FS, • A+B rms/mean = 0.65%, A-B / A+B rms = 0.092% • 69 mm for 75 mm BPM (92 mm for 100 mm BPM) • Using another BPM board’s DAC as source (clocks not synchronized), still at ¾ FS, • A+B rms/mean 0.4%, AB / A+B rms 0.13% • Would be interesting to understand why this does worse than AWG
These plots are 1 entry per channel per board Relative gain settings (ask for -6dB, what do you get) vary 1.5% (rms/mean) Absolute channel gains vary 10% (rms/mean) CPU corrects each “B” signal for gain ratio between “A” and “B”
This sort of effect – I vs. Q gains, pedestals, etc. – is likely part of our “excess” resolution We already subtract separate I,Q pedestals, but perhaps we could do better
To-do list • Remote software update needs to be finished • Better debug handles, e.g. waveform readout (partially exists) • Make lots of debug info accessible without creating a dozen new ACNET devices per BPM • Streamlined (automatic) handling of stacking vs. studies settings • Simple application to manage calibration constants, gain settings, timing offsets, etc. • More comprehensive set of bench measurements may be nice • Try mixing down with 52 MHz, not 53.1, followed by digital downconversion in FPGA? Better resolution?? • Implement “fast” fast time plots (as done for damper board)?? • Use SDRAM for circular buffer • Decode TCLK, MIBS directly
Other applications? • MI SBD trigger module (Nathan Eddy, Bob Flora): done • DRF2 AWG: in place (but needs ACNET hooks) • Very similar boards do various Debuncher LLRF functions • D to A line (boards in place; need better tunnel electronics) • Debuncher 53 MHz BPM orbits while stacking (likely) • Already use one BPM as intensity monitor: switch SA for BPM board? • Downconvert 75 / 79 MHz diagnostic schottky signals? • Phase meter for MI injection?? • Could do bunch length, too, if modified for 106 or 159 MHz operation • Could potentially replace many “turn-by-turn” oscilloscope setups (pickup + RF + mixer + LPF + scope + console app)