Download
1 / 14
140 likes | 278 Views
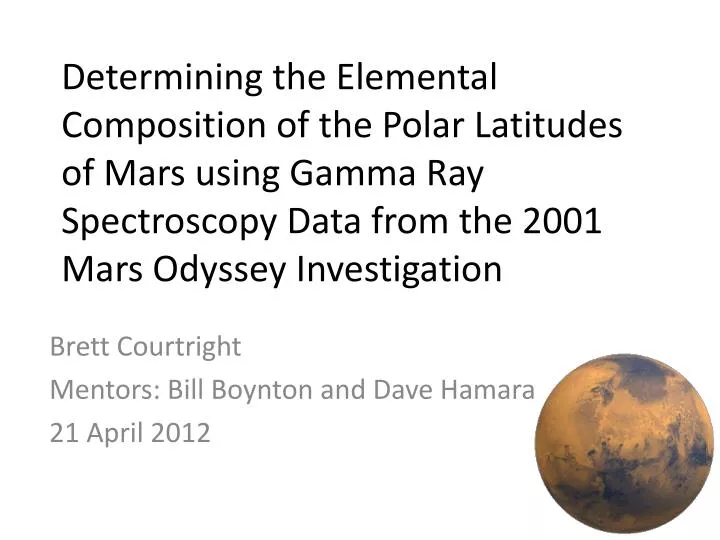
Determining the Elemental Composition of the Polar Latitudes of Mars using Gamma Ray Spectroscopy Data from the 2001 Mars Odyssey Investigation. Brett Courtright Mentors: Bill Boynton and Dave Hamara 21 April 2012. Problem Statement.

E N D
Determining the Elemental Composition of the Polar Latitudes of Mars using Gamma Ray Spectroscopy Data from the 2001 Mars Odyssey Investigation Brett Courtright Mentors: Bill Boynton and Dave Hamara 21 April 2012
Problem Statement • Elements in the Martian regolith (surface soil) emit gamma-rays due to cosmic-ray excitation. • These gamma rays are then detected by a gamma-ray spectrometer (GRS) aboard the Mars Odyssey satellite. • The GRS instrument counts the number of gamma rays as well as detects their energies.
Problem Statement • The problem with the GRS signal at the poles is two-fold: • There is an unknown amount of ice below the surface which decreases the gamma ray emissions due to dilution. • This same ice enhances thermal neutrons (excitation source of the gamma rays). • This ultimately increases the emission of gamma rays from the regolith that is associated with this ice.
Problem Statement • Previously, the polar regions have been “masked” before publishing because it was unclear how to accurately process the data. Ca via old method
Approach to Problem • A new processing method was developed to account for the two competing processes. • Following assumptions are made: • The weight percent of silicon is constant over the entire planet (ice-free basis at the poles). • Other elements experience the same dilution and neutron excitation as Si.
Approach to Problem • Most of this map is between 19 and 21%. The mid-latitude mean is taken to be 19.9 +/- 0.9 Si via old method
Approach to Problem • By dividing an elemental map by the silicon map and then multiplying by the average value of silicon over the mid-latitudes, the actual concentration over the whole planet is obtained.
Results • Polar latitudes now have a concentration Ca via new method
Results • Comparison of new map with old map Ca via new method Ca via old method
Results • Less uncertainty in the original masked map than in the new map. • Therefore, we would like to “stitch” the original mid-latitude map with the polar latitudes of the new map. • This provides a smaller uncertainty in the mid-latitudes but at the same time represents the polar concentrations.
Results • Two maps “stitched” together. Ca, new method and old method stitched together
Applications of Results • Maps made for Ca, Fe, Cl, S, Si, Al • With useful data at the poles, trends can be observed in the poles that might not be seen in the mid-latitudes. • For instance, the next two slides show that the Fe to S correlation is stronger in the polar latitudes than in the mid-latitudes.
Applications of Results • S to Fe correlation in mid-latitudes R2 = 0.03739
Applications of Results • S to Fe correlation in polar regions R2 = 0.41228 Note: the black dots represent the mid-latitude data points and are not included in this fit.