Download
1 / 28
280 likes | 386 Views
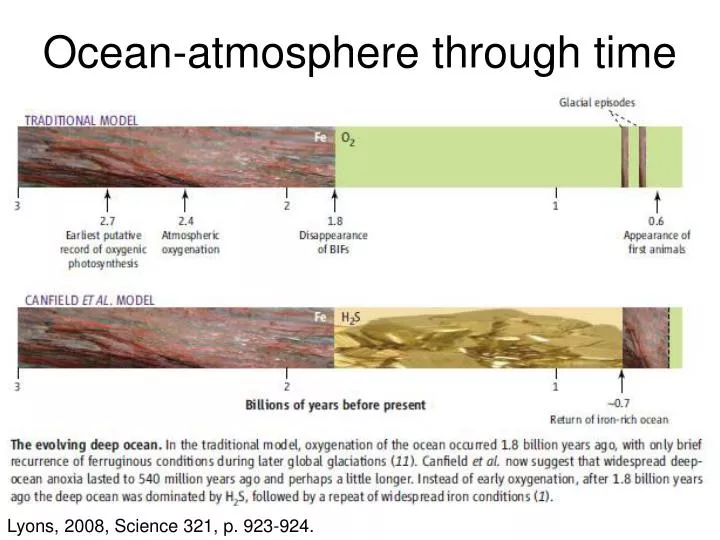
Ocean-atmosphere through time. Lyons, 2008, Science 321, p. 923-924. From Reinhard et al., 2009, Science Vol.326, p. 713. Earth’s Oceans @ 2.5 Ga. From Reinhard et al., 2009, Science Vol.326, p. 713. Geomicrobiology. Classification of life forms:

E N D
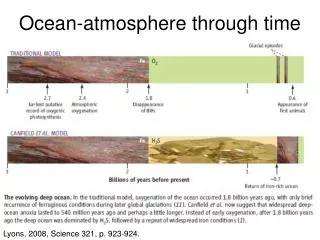
Ocean-atmosphere through time Lyons, 2008, Science 321, p. 923-924.
Earth’s Oceans @ 2.5 Ga From Reinhard et al., 2009, Science Vol.326, p. 713
Classification of life forms: • Eukaryotic = Plants, animals, fungus, algae, and even protozoa • Prokaryotic = archaea and bacteria • Living cells can: • Self-feed • Replicate (grow) • Differentiate (change in form/function) • Communicate • Evolve Can purely chemical systems do these things? All of these things? Why do we care to go through this ?
Diversity • There are likely millions of different microbial species • Scientists have identified and characterized ~10,000 of these • Typical soils contain hundreds- thousands of different species • Very extreme environments contain as little as a few different microbes
Characterizing microbes • Morphological and functional – what they look like and what they eat/breathe • Based primarily on culturing – grow microbes on specific media – trying to get ‘pure’ culture • Genetic – Determine sequence of the DNA or RNA – only need a part of this for good identification • Probes – Based on genetic info, design molecule to stick to the DNA/RNA and be visible in a microscope
Environmental limits on life • Liquid H2O – life as we know it requires liquid water • Redox gradient – conditions which limit this? • Range of conditions for prokaryotes much more than that of eukaryotes – inactive stasis • Spores can take a lot of abuse and last very long times • Tougher living = less diversity • Closer to the limits of life – Fewer microbes able to function
Profiles and microbial habitats Life requires redox disequilibrium!! O2 O2 3 2 Fe2+ depth H2S 4 H2S 1 Org. C Org. C Concentration
Phototrophic mats - PSB • Purple sulfur bacteria mats • Respond to light level changes in minutes position in sediment and water column can vary significantly!
Cell Metabolism • Based on redox reactions • Substrate (food) – electron is lost from this (which is oxidized by this process) • that electron goes through enzymes to harness the energy for the production of ATP • Electron eventually ends up going to another molecule (which is reduced by this)
O2 Aerobes Oxic H2O Dinitrofiers NO3- N2 Maganese reducers Post - oxic MnO2 Mn2+ Iron reducers Fe(OH)3 Fe2+ SO42- Sulfate reducers Sulfidic H2S CO2 Methanogens CH4 Methanic H2O H2 The Redox ladder The redox-couples are shown on each stair-step, where the most energy is gained at the top step and the least at the bottom step. (Gibb’s free energy becomes more positive going down the steps)
O2/H2O C2HO Redox gradients and life • Microbes harness the energy present from DISEQUILIBRIUM • Manipulate flow of electrons
Nutrition value • Eukaryotes (like us) eat organics and breathe oxygen • Prokaryotes can use other food sources and acceptors
Microbes, e- flow • Catabolism – breakdown of any compound for energy • Anabolism – consumption of that energy for biosynthesis • Transfer of e- facilitated by e- carriers, some bound to the membrane, some freely diffusible
Exergonic/Endergonic • Thermodynamics tells us direction and energy available from coupling of 2 half-reactions • Energy available = -DG0 = exergonic • Organisms use this energy for life!!
Calculating Potential Energy Thermodynamic Modeling ∆Gr = ∆Gr ۫ + RTlnQ ∆Gr ۫ = Σ vi,r * ∆Gi ۫ (products) - Σ vi,r * ∆Gi ۫ (reactants) Q = π ai vi,r(products)- π ai vi,r(reactants) R = 8.3141 J/mol*K (Gas Constant) T = 85 C
Calculating Potential Energy Thermodynamic Modeling • Example • 2 S5-2 + 2 H+ = 2 HS- + S8 Q = ((HS-)2 * S)/(( S5-2)2 * (H+)2) Q = 2.46E-9 kJ/mol ∆Gr۫= ((HS-)2 + (S)) -((S5-2)2 + (H+)2) ∆Gr۫= -101.64 kJ/mol ∆Gr = ∆Gr ۫ + RTlnQ ∆Gr = -101.64 + 8.3141*358.15*ln(2.46E-9) ∆Gr = -160.17 kJ/mol for 4 electrons ∆Gr/e- = -40 kJ/mol
NAD+/NADH and NADP+/NADPH • Oxidation-reduction reactions use NAD+ or FADH (nicotinamide adenine dinucleotide, flavin adenine dinucleotide). • When a metabolite is oxidized, NAD+ accepts two electrons plus a hydrogen ion (H+) and NADH results. NADH then carries energy to cell for other uses
glucose e- • transport of • electrons coupled • to pumping protons CH2O CO2 + 4 e- + H+ 0.5 O2 + 4e- + 4H+ H2O
Proton Motive Force (PMF) • Enzymatic reactions pump H+ outside the cell, there are a number of membrane-bound enzymes which transfer e-s and pump H+ out of the cell • Develop a strong gradient of H+ across the membrane (remember this is 8 nm thick) • This gradient is CRITICAL to cell function because of how ATP is generated…
HOW IS THE PMF USED TO SYNTHESIZE ATP? • catalyzed by ATP synthase BOM – Figure 5.21
Other nutrients needed for life • Besides chemicals for metabolic energy, microbes need other things for growth. • Carbon • Oxygen • Sulfur • Phosphorus • Nitrogen • Iron • Trace metals (including Mo, Cu, Ni, Cd, etc.) • What limits growth??
Nutrients • Lakes are particularly sensitive to the amount of nutrients in it: • Oligotrophic – low nutrients, low photosynthetic activity, low organics clear, clean… • Eutrophic – high nutrients, high photosynthetic activity, high organics mucky, plankton / cyanobacterial population high • Plankton growth: • 106 CO2 + 16 NO3- + HPO42- + 122 H2O + 18 H+ + trace elements + light C106H263O110N16P1 + 138 O2 (organic material composing plankton) • This C:N:P ratio (106:16:1) is the Redfield Ratio • What nutrients are we concerned with in Lake Champlain?
Nutrient excess can result in ‘blooms’
Lake Champlain • Phosphorus limited? • Algal blooms • What controls P??
Nutrient cycling linked to SRB-IRB-MRB activity PO43- PO43- PO43- PO43- PO43- PO43- PO43- PO43- Org C + SO42- FeOOH FeS2 H2S Blue Green Algae blooms Sulfate Reducers