Download
1 / 40
400 likes | 522 Views
Literacy in PEI Implications of Findings From IALSS 2003. Presented by Satya Brink, Ph.D. Director, National Learning Policy Research Learning Policy Directorate May 2006. Introduction. Key Questions. What is the level of literacy proficiency in PEI?

E N D
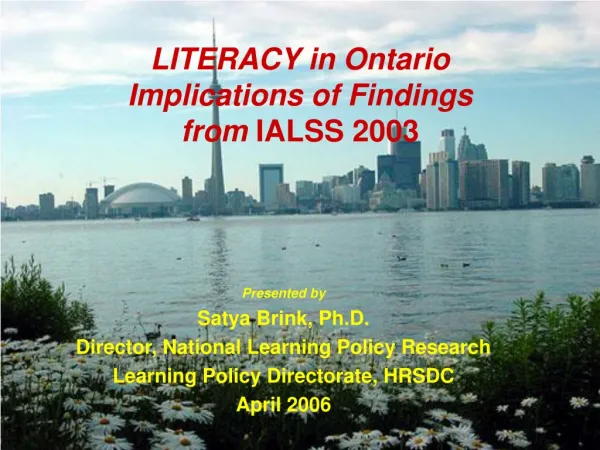
Literacy in PEIImplications of FindingsFrom IALSS 2003 Presented by Satya Brink, Ph.D. Director, National Learning Policy Research Learning Policy Directorate May 2006 HRSD, Learning Policy Directorate
Introduction Key Questions • What is the level of literacy proficiency in PEI? • How does PEI compare to Canada, other provinces and territories? • How proficient are residents of PEI in the different component skills? • How is literacy performance distributed in the working age population of PEI/Atlantic? • What is the level of literacy proficiency among males and females in PEI? • How do age and education affect the literacy and numeracy performance? • How is literacy performance distributed in the labor force, among immigrants, occupations, industries and earning groups? • What are the demographic characteristics of people with low literacy proficiency and where are they located in PEI? HRSD, Learning Policy Directorate
Introduction Literacy proficiency: the ability to understand and employ printed information in daily activities, at home, at work and in the community. It is not about whether or not one can read but how well one reads. 4 Domains, measure skills at five levels: • Prose:The knowledge and skills needed to understand and use information from texts including editorials, news stories, brochures and instruction manuals. • Document: The knowledge and skills required to locate and use information contained in various formats, including job applications, payroll forms, transportation schedules, maps, tables, and charts. • Numeracy:The knowledge and skills required to apply arithmetic operations, either alone or sequentially, to numbers embedded in printed materials, such as balancing an account, figuring out a tip, completing an order form or determining the amount of interest on a loan from an advertisement . • Problem Solving:Involves goal-directed thinking and action in situations for which no routine solution procedure is available. The understanding of the problem situation and its step-by-step transformation, based on planning and reasoning constitute the process of problem solving. (Only four proficiency levels) • Level 1 0 - 225 points • Level 2 226 -275 points • Level 3 276-325 points* • Level 4 326 -375 points • Level 5 376 -500 points * Proficiency level for modern economy and knowledge-based society HRSD, Learning Policy Directorate
Introduction Background information of importance for IALSS results. Total population (2003) 137,300 Population/square km 24 Population 15-65 (2005) 94,200 Population 65 and over (2005) 19,500 Immigrant population (2001) 4,140 Gender Distribution (15-64, 2005) Males 46,300 Females 47,900 Population by mother tongue (Census 2001) English only 125,125 French only 5,665 Non-official languages only 2,065 English and French 440 Eng. And non-off language 85 Population 15 years and over by highest level of schooling (Census 2001) Less than high school 36,720 High school graduate 12,350 Trade Vocational cert. 3,485 College education 25,780 University 25,175 HRSD, Learning Policy Directorate Source: Statistics Canada
Change between 1994 and 2003, Canada The number of persons (16 to 65) with low literacy rose from 8 m in 1994 to 9 m in 2003 though the percentage (42%) did not change. IALS IALSS 4.2 million 4.1 million 8.2 million 6.7 million 4.6 million 5.8 million 3.1 million 3.1 million Total: 18.4 million Total: 21.4 million *Differences at each level between IALS and IALSS are not statistically significant HRSD, Learning Policy Directorate Source: IALSS, 2003; IALS, 1994.
Change between 1994 and 2003, Atlantic In the Atlantic region, the number of persons (16 to 65) with low literacy rose slightly from 1.5 m in 1994 to 1.6 m in 2003 (population 16 to 65) 0.3 million 0.3 million 0.5 million 0.6 million 0.4 million 0.5 million 0.3 million 0.2 million Total: 1.5 million Total: 1.6 million *Differences at each level between IALS and IALSS are not statistically significant HRSD, Learning Policy Directorate Sources: IALSS, 2003; IALS, 1994
PEI performance Comparisons of provinces and territories based on average scores. Prose, population 16 and older, 2003 HRSD, Learning Policy Directorate
PEI performance Gross domestic product (GDP) per capita and numeracy proficiency average score in 2003, Canada and Provinces (population 16-65) IALSS 2003, 16-65 years HRSD, Learning Policy Directorate Source: IALSS 2003
PEI literacy performance PEI proficiency varied across domains and population age Average proficiency scores, population 16 and older and population 16 to 65, PEI, 2003 - Below level 3 * Proficiency levels are defined differently for problem solving Source: IALSS, 2003 HRSD, Learning Policy Directorate
PEIperformance In PEI, the distribution of prose literacy proficiency is more favourable in the working age population compared to 16 and over, similar to most provinces and territories Per cent of population aged 16 and older and 16-65 at each prose level, 2003 16 and over 16-65 HRSD, Learning Policy Directorate Source: IALSS, 2003
PEIperformance PEI has average scores in document and prose literacy at level 3 and at level 2innumeracy (population 16-65) Below level 3 in 3 domains Below level 3 in Numeracy but not in literacy. HRSD, Learning Policy Directorate Source: IALSS, 2003
PEI performance Yukon had the lowest proportion overall (31%) of prose literacy below level 3. In PEI, 43% of the working-age population (16-65) had an average prose literacy proficiency below level 3. Percent of population 16 to 65 at each prose level by provinces and territories, 2003 HRSD, Learning Policy Directorate Source: IALSS, 2003
PEI performance Yukon had lowest proportion of working-age adults below level 3 in numeracy (41%). In PEI the proportion of working-age adults below level 3 in numeracy was of 54%. Percent of population 16 to 65 at each numeracy level by provinces and territories, 2003 Source: IALSS, 2003 HRSD, Learning Policy Directorate
PEI performance Impact of low literacy in the population 16-65. HRSD, Learning Policy Directorate Total 8,849,000 Source: IALSS, 2003
PEI performance Impact of low numeracy in the population 16-65. Source: IALSS, 2003 HRSD, Learning Policy Directorate Total 10,682,000
PEI performance The proportion of PEI residents at levels 1 and 2 varied by 11 percentage points between literacy and numeracy. Per cent of adult populations performing at levels 1 and 2 in ALL 2003 Poor Good Source: IALSS, 2003 HRSD, Learning Policy Directorate
PEI performance PEI residents with high school education score better in prose literacy than counterparts in 8 provinces and territories (16 and over) Literacy proficiency by educational attainment, Canada, 2003 Source: IALSS, 2003 HRSD, Learning Policy Directorate
PEI performance Prose Literacy proficiency by educational attainment in the provinces and territories. Mean prose proficiency scores by education level, population 16 and over, Canada and jurisdictions, 2003 Source: IALSS, 2003 HRSD, Learning Policy Directorate
Gender in PEI Women in PEI performed significantly better than men in prose and tend to do better in the other domains as well * Differences for document, numeracy and problem solving not significant Source: IALSS, 2003 HRSD, Learning Policy Directorate
Youth in PEI In PEI, a larger share of youth have prose literacy proficiencybelow level 3 (46%) compared to Nova Scotia (39%) or New Brunswick (38%) or Newfoundland and Labrador (43%) Distribution of proficiency level on the prose literacy scale for youth age 16-25, Canada, 2003 Source: IALSS, 2003 HRSD, Learning Policy Directorate
Seniors in PEI The majority of seniors (19,500, 14%) in PEI have low literacy skills. Distribution of proficiency level on the prose literacy scale for those older than 65 years, provinces and territories, 2003 Source: IALSS, 2003 HRSD, Learning Policy Directorate
Performance by Age, PEI In Canada and in PEI prose literacy scores decline with age; in PEI, the scores are higher in the 26-35 age group. HRSD, Learning Policy Directorate Source: IALSS, 2003
Number of people by proficiency level 40,000 (43% of the population 16-65) residents of PEI had prose literacy scores below level 3. 4.2m 18,000 8.2m 36,000 5.8m 27,000 3.1m 13,000 21.4m 94,000 Source: IALSS, 2003 HRSD, Learning Policy Directorate
Low literacy performance Main characteristics of people at level 1 and 2 in prose IALSS in PEI (population 16-65) • Level 1 • 13,000 • 69 % were male and 31% female • 64% were employed • 14% were unemployed • Education: • 69% less than high school; • 20% had completed high school • 11% had post-secondary education • Level 2 • 27,000 • 53% were male and 47% female • 58% were employed • 11% were unemployed • Education: • 36% less than high school; • 34% had completed high school • 30% had post-secondary education Source: IALSS, 2003 HRSD, Learning Policy Directorate
Literacy performance and employment 47% of those at level 1 and 60% of those at level 2 in the Atlantic were employed. Per cent of employed population in each document literacy level, population 16 to 65, Canada and Regions, 2003 Atlantic HRSD, Learning Policy Directorate Source: IALSS, 2003
Literacy performance and employment In PEI, unemployed workers and those not in the labour force had an average prose score below level 3 Source: IALSS 2003 HRSD, Learning Policy Directorate
Low literacy and employment Persons with low prose literacy were concentrated among certain industries, Canada and PEI. (Population 16-65) *These industries employed roughly 60% of the workers at levels 1 and 2 Total: 1,257,000 2,666,000 HRSD, Learning Policy Directorate Source: IALSS, 2003
Literacy performance- Occupation The majority of knowledge experts score at Level 3 or above in prose literacy in the regions and the Territories. Per cent of Labour force population at prose levels 3 and 4/5 by type of occupations, population 16 to 65, Canada and regions, 2003 Atlantic HRSD, Learning Policy Directorate Source: IALSS, 2003
Literacy performance- Occupation Workers in knowledge-related occupations tend to engage more often in writing at work than do low-skill information, services and goods production workers. Index scores of writing engagement at work on a standardized scale (centered on 2) by aggregated occupational types, labour force population, 16 to 65, 2003 Legend Occupation Types 1 Knowledge expert 2 Managers 3 Information high-skills 4 Information low-skills 5 Services low-skills 6 Goods Atlantic Source: IALSS, 2003 HRSD, Learning Policy Directorate
Literacy performance- Industry Knowledge intensive sectors had higher proportions of adults with document literacy proficiency above level 3. 70% of knowledge intensive industry workers in the Atlantic had proficiency levels above level 3. Per cent of labour force populations (16-65) at document literacy Levels 3 and 4/5, by type of industry, 2003 Atlantic HRSD, Learning Policy Directorate Source: IALSS 2003
Literacy performance- Industry In all industrial sectors in the Atlantic, at least 35% of workers had proficiency levels above level 3 in numeracy. Per cent of labour force population at numeracy levels 3 and 4/5, by type of industry, population 16 to 65, Canada and regions, 2003 Atlantic Source: IALSS, 2003 HRSD, Learning Policy Directorate
Literacy performance- Immigrants in Canada Regardless of level of literacy proficiency most immigrants were employed but were they under employed? HRSD, Learning Policy Directorate Source: IALSS, 2003
Literacy performance- Immigrants in Canada A high number of immigrants at level 1 and 2 proficiency in English and French have post secondary education HRSD, Learning Policy Directorate Source: IALSS, 2003
Literacy performance- Adult training participation About 45% of workers participated in adult training in PEI compared to 50% in Canada. Per cent of population receiving adult education and training the year preceding the interview, by type of participation, population 16 to 65, Canada and jurisdictions, 2003 Source: IALSS, 2003 HRSD, Learning Policy Directorate
Literacy performance-ICT 67% of PEI residents have access to a computer at home compared to 76% of Canadians aged 16 to 65 years. Computer and Internet access at home Per cent of adults aged 16-65 who report having access to a computer and the Internet at home, Canada and jurisdictions, 2003 HRSD, Learning Policy Directorate Source: IALSS, 2003
Literacy performance- Health Generally, 16 to 65 year-olds in poor health have the lower average document literacy scores. Physical Component Summary (PCS) scores by mean document literacy proficiency by age groups, Canada and regions, 2003 Note : Orders the provinces and territories by the size of the difference in average document literacy between those in poor health and those in excellent health. HRSD, Learning Policy Directorate Source: IALSS, 2003
Improving literacy in PEI Policy sensitive targets should be directed toward those with less than high school and those with a mother tongue other than English or French. *Non significant Regression analysis. Canada and PEI; significant results only shown. Base group: -26-45 -Those with high school -Mother tongue English 16-25 46-65 Less than High School PSE Mother tongue French HRSD, Learning Policy Directorate Source: IALSS 2003
Concentration of people at levels 1 and 2 in prose in Prince Edward Island (IALSS population 16-65). HRSD, Learning Policy Directorate Source: IALSS 2003
Concentration of people at levels 4 and 5 in prose inPrince Edward Island (IALSS population 16-65). HRSD, Learning Policy Directorate Source: IALSS 2003
Contact Information: Satya Brink, Ph.D. Director, Policy Research Learning Policy Directorate Human Resources and Skills Development Canada Place du Portage, Phase IV, 3 Floor 140 Promenade du Portage Gatineau, QC K1A 0J9 Tel: 819-953-6622 Fax: 819-997-5433 Satya.Brink@hrsdc-rhdcc.gc.ca HRSD, Learning Policy Directorate