Download
1 / 20
200 likes | 317 Views
Syntheses of key findings and implications Improving Competitiveness of Pig Producers in an Adjusting Vietnam Market ACIAR Project Workshop Army Hotel, Hanoi 24-25 March 2010. Rates of return. Pig producers earn revenues that can cover costs and generate some positive profits. Title.

E N D
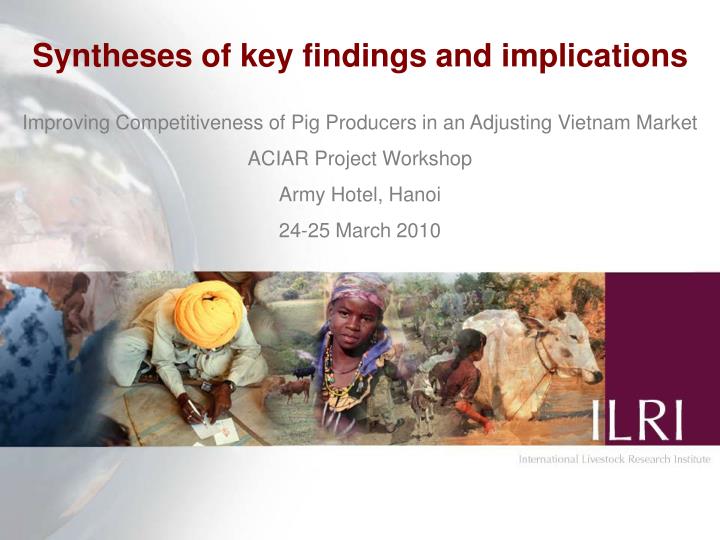
Syntheses of key findings and implications Improving Competitiveness of Pig Producers in an Adjusting Vietnam Market ACIAR Project Workshop Army Hotel, Hanoi 24-25 March 2010
Rates of return Pig producers earn revenues that can cover costs and generate some positive profits.
Title Diseconomies of scale in FF and GF; no significant difference across scale in FF
Title Increasing the proportion of own-produced feed to total feed use can decrease total feed cost. This provides cost advantage to small producers that use higher proportion of own-produced feed.
Unpacking variable costs • Feed costs account for at least two-thirds of total costs. • Proportion of purchased feed increases with scale. • Technical efficiency in feed use (FCR) increases with scale. • But cost efficiency decreases with scale. • Increasing the proportion of own produced feed provides cost advantage • Small producers can exploit this cost advantage to improve their competitiveness.
Share of retail price that accrues to producers (based on average pork retail price of 40,000VND/kg in 2007) Producers receive at least half to two-thirds of the retail price of pork. This share increases with scale.
Revenue-cost ratio by type of output buyer (FW) 1.4 Local Farmer • Small producers generate • relatively higher R-C ratios from selling piglets to local farmers. • Medium producers generate • relatively higher R-C ratios from selling piglets to external traders (i.e., • not from the local community). • Large producers generate • Relatively higher R-C ratios from selling piglets to external traders. Small 1.8 2.2 1.8 Local Trader 1.9 Medium 1.8 1.7 External Trader 1.7 2.1 Large Butcher 0.8
Revenue-cost ratio by type of output buyer (FF) 1.8 Local Farmer • Small producers generate • relatively higher R-C ratios from selling pigs to local traders. • Medium producers generate • relatively higher R-C ratios from selling pigs to local traders or butchers. • There is not much difference in R-C ratios that large producers generate from selling pigs to different buyers. Small 2.2 Local Trader 1.8 Medium 1.6 1.5 External Trader 1.7 1.5 1.4 Large 1.8 1.7 Butcher 1.5
Revenue-cost ratio by type of output buyer (GF) 1.5 Local Farmer • Small producers generate • relatively higher R-C ratios from selling pigs to external traders. • Medium producers generate • relatively higher R-C ratios from selling pigs to local farmers. • There is not much difference in R-C ratios that large producers generate from selling pigs to different buyers. Small 1.7 1.6 Local Trader 1.4 Medium 1.3 1.9 External Trader 1.7 1.5 1.3 Large 1.3 Butcher 1.3
Revenue-cost ratio by type of input supplier (FW) 1.4 • Small producers generate relatively higher R-C ratios linked with retail traders of feed. • No difference in R-C rations in medium producers linked to retail trader or crop farmer. • No basis of comparison by input supplier for large producer, but value of R-C is relatively higher than small or medium. Wholesale Trader Small 1.8 1.5 Retail Trader 1.9 Medium 1.9 Crop farmer Large 1.96 Own produced
Revenue-cost ratio by type of input supplier (FF) 1.96 Wholesale Trader Small 1.8 • Small, medium and large producers generate relatively higher R-C ratios linked with wholesale traders of feed. 1.3 Retail Trader 2.6 Medium 1.7 Crop farmer 1.8 Large 1.4 Own produced
Revenue-cost ratio by type of input supplier (GF) 1.97 • Small producers generate relatively higher R-C ratios with own-produced feed. • Medium producers have higher R-C ratios with feed supply from crop farmers. • No significant difference in R-C ratios of large producers by type of feed supply linkage. Wholesale Trader Small 1.5 1.6 3.9 Retail Trader 1.4 Medium 1.6 Crop farmer 1.2 Large 1.3 Own produced
Conclusions • Under current conditions, smallholder pig producers are still able to generate incomes from pig raising by exploiting areas where they have cost advantage. • Expanding options for own-produced feeds, in terms of choices and quality, can potentially enhance their competitiveness, and these can be effectively facilitated when targeted to producers located far from feed sources (North), and complemented with improved access to extension. • Production system is less likely an important driver of feed choice as it in in breed choice.
Conclusions • Improved breed adoption is strongly associated with scale. • Pig producers appear to be able to capture a reasonable share of end product prices, suggesting a reasonably competitive output market • The likely impact of differential access to different feed suppliers is mixed across scale. Both small and large producers can similarly access almost the same type of feed suppliers.
International Livestock Research Institute Better lives through livestock Animal agriculture to reduce poverty, hunger and environmental degradation in developing countries ILRI www.ilri.org
Title • 1. • 2. • 3. • 4. • 5. • 6.