Download
1 / 49
490 likes | 671 Views
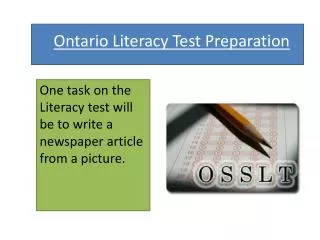
LITERACY in Ontario Implications of Findings from IALSS 2003. Presented by Satya Brink, Ph.D. Director, National Learning Policy Research Learning Policy Directorate, HRSDC April 2006. Introduction. Key Questions. What is the level of literacy proficiency in Ontario?

E N D
LITERACY in OntarioImplications of Findingsfrom IALSS 2003 Presented by Satya Brink, Ph.D. Director, National Learning Policy Research Learning Policy Directorate, HRSDC April 2006 HRSD-Learning Policy Directorate
Introduction Key Questions • What is the level of literacy proficiency in Ontario? • How does Ontario compare to Canada, the provinces and other territories? • How proficient are residents of Ontario in the different component skills? • How is literacy performance distributed in the working age population of Ontario? • How do age and education affect the literacy and numeracy performance? • How does the performance of the French minority in Ontario compare to the performance of the English majority. • How is literacy performance distributed in the labor force, immigration, occupations, industries and earning groups? • What are the demographic characteristics of people with low literacy proficiency and where are they located in Ontario? HRSD-Learning Policy Directorate
Introduction Literacy proficiency: the ability to understand and employ printed information in daily activities, at home, at work and in the community. It is not about whether or not one can read but how well one reads. 4 Domains, measure skills at five levels: • Prose:The knowledge and skills needed to understand and use information from texts including editorials, news stories, brochures and instruction manuals. • Document: The knowledge and skills required to locate and use information contained in various formats, including job applications, payroll forms, transportation schedules, maps, tables, and charts. • Numeracy:The knowledge and skills required to apply arithmetic operations, either alone or sequentially, to numbers embedded in printed materials, such as balancing an account, figuring out a tip, completing an order form or determining the amount of interest on a loan from an advertisement . • Problem Solving:Involves goal-directed thinking and action in situations for which no routine solution procedure is available. The understanding of the problem situation and its step-by-step transformation, based on planning and reasoning constitute the process of problem solving. (Only four proficiency levels) • Level 1 0 - 225 points • Level 2 226 -275 points • Level 3 276-325 points* • Level 4 326 -375 points • Level 5 376 -500 points * Proficiency level for modern economy and knowledge-based society HRSD-Learning Policy Directorate
Introduction Background information of importance for IALSS results: Ontario Total population (2003) 12,259,600 Population/square km 12 app. Population 15-64 (2005) 8,656,300 Population 65 and over (2005) 1,608,700 Immigrant population (2001) 3,030,075 Gender Distribution (15-64, 2005) Males 4,327,200 Females 4,329,100 Population 15 years and over by highest level of schooling (Census 2001) Less than high school 2,683,335 High school graduate 1,303,960 Trade Vocational cert. 287,540 College education 2,291,805 University 2,481,395 Population by mother tongue (Census 2001) English only 7,965,225 French only 485,630 Non-official languages only 2,672,085 English and French 37,135 Eng. and non-off language 114,275 French and non-off language 8,000 Source: Statistics Canada HRSD-Learning Policy Directorate
Change between 1994 and 2003, Canada The number of persons (16 to 65) with low literacy rose from 8 m in 1994 to 9 m in 2003 though the percentage (42%) did not change. IALS IALSS 4.1 million 4.2 million 6.7 million 8.2 million 4.6 million 5.8 million 3.1 million 3.1 million Total: 21.4 million Total: 18.4 million *Differences at each level between IALS and IALSS are not statistically significant Source: IALSS, 2003; IALS, 1994. HRSD-Learning Policy Directorate
Ontario performance Comparisons of provinces and territories based on average scores. Prose, population 16 and older, 2003 HRSD-Learning Policy Directorate
Ontario literacy performance Proficiency varied across domains and population age in Ontario. Average proficiency scores, population 16 and older and population 16 to 65, Ontario, 2003 - Below level 3 * Proficiency levels are defined differently for problem solving HRSD-Learning Policy Directorate Source: IALSS, 2003
Ontarioperformance Ontario had average scores at level 3in document and prose, but at level 2 in numeracy (population 16-65). Below level 3 in 3 domains Below level 3 in numeracy but not in literacy. Source: IALSS, 2003 HRSD-Learning Policy Directorate
Ontario performance Yukon had the lowest proportion overall (31%) of prose literacy below level 3. In Ontario, 42% of the working-age population (16-65) had an average prose literacy proficiency below level 3. Percent of population 16 to 65 at each prose level by provinces and territories, 2003 HRSD-Learning Policy Directorate Source: IALSS, 2003
Ontario performance Yukon had the lowest proportion of working-age adults below level 3 in numeracy (41%). In Ontario, the proportion of working-age adults below level 3 in numeracy was 50%. Percent of population 16 to 65 at each numeracy level by provinces and territories, 2003 Source: IALSS, 2003 HRSD-Learning Policy Directorate
Ontario performance The importance of language: although Ontario keeps a distribution similar to the Canadian average, the proportion of Ontarians at level 3 or above increases by 7% when we only consider people with French and/or English mother tongue. Distribution of the population aged 16 to 65 and whose mother tongue is English or French by prose level, Canada, provinces and territories Significantly above Canadian average Not significantly different than the Canadian average Significantly below Canadian average HRSD-Learning Policy Directorate Source: EIACA, 2003
Ontario performance Impact of low literacy in the population 16-65. Total 8,849,000 HRSD-Learning Policy Directorate
Ontario performance Impact of low numeracy in the population 16-65. Total 10,681,000 Source: IALSS, 2003 HRSD-Learning Policy Directorate
Ontario performance Gross domestic product (GDP) per capita and numeracy proficiency average score in 2003, Canada and Provinces (population 16-65) IALSS 2003, 16-65 years Sources: IALSS 2003 and Statistics Canada HRSD-Learning Policy Directorate
Ontario performance The proportion of Ontario residents at levels 1 and 2 varied by 8 percentage points between literacy and numeracy. Per cent of population 16-65 performing at levels 1 and 2 in IALSS, 2003 Poor Good Source: IALSS, 2003 HRSD-Learning Policy Directorate
Ontario performance Residents of Ontario did not have average scores significantly different from the Canadian average in prose literacy at all levels of education. Mean prose proficiency scores by education level, population 16 and over, Canada, provinces and territories, 2003 Source: IALSS, 2003 HRSD-Learning Policy Directorate
Youth in Ontario In most jurisdictions, the majority of people aged 16-25 had prose literacy at level 3 or above. In Ontario, about 60% of young people had prose literacy scores at level 3 or above. Distribution of proficiency level on the prose literacy scale for youth age 16-25, Canada, provinces et territoires, 2003 Source: IALSS, 2003 HRSD-Learning Policy Directorate
Seniors in Ontario In Ontario, the majority of people aged 65 and above (1,608,700; 13% of the total population) had levels of proficiency below level 3 in prose literacy. Distribution of proficiency level on the prose literacy scale for those older than 65 years, provinces and territories, 2003 Source: IALSS, 2003 HRSD-Learning Policy Directorate
Performance by age, Ontario In Canada, average prose literacy scores decreased with age. In Ontario, the populations aged 16-25, 26-35 and 36-45 had average prose scores at level 3. HRSD-Learning Policy Directorate Source : IALSS, 2003
Number of people by proficiency level About 3,4 million residents of Ontario scored below level 3 in prose literacy. 1,6m 4,2m 3,2m 8,2m 2,1m 5,8m 3,1m 1,3m 21,4m 8,3m Source: IALSS, 2003 HRSD-Learning Policy Directorate
Level 1 1,3 million 61% (817,000) were immigrants 54% were male and 46% were female 62% were employed 9% were unemployed Education: 46% had not completed high school education 32% had completed high school education 22% had completed postsecondary education Mother tongue: 40% English 4% French 55% others Level 2 2,1 millions 33% (747,000) were immigrants 52% were male and 48% were female 72% were employed 9% were unemployed Education: 25% had not completed high school education 36% had completed high school education 39% had completed postsecondary education Mother tongue : 65% English 5% French 30% others Low literacy scores in Ontario Principal characteristics of people at levels 1 and 2 in prose literacy in Ontario (population 16 to 65). Source: IALSS, 2003 HRSD-Learning Policy Directorate
French Minority in Ontario In Ontario, 64% of Francophones chose to be evaluated in English (population 16 and above). • Outside Quebec, about 65% of Francophones chose to be evaluated in English. • In Ontario, 64% of Francophones were evaluated in English. In Canada, Francophones who were evaluated in English scored above Francophones who were evaluated in French Half of Francophones outside Quebec who wrote the exam in English did not reach level 3 in prose literacy. On the other hand, 62% of Francophones evaluated in French did not reach level 3 Source: IALSS, 2003 HRSD-Learning Policy Directorate
French minority in Ontario In Ontario, 56% of people with French mother tongue had a literacy level below level 3. Distribution of the population according to mother tongue and prose literacy proficiency level, Quebec, New Brunswick, Ontario, Manitoba and Canada, 2003 Source: IALSS, 2003 HRSD-Learning Policy Directorate
French minority in Canada At all levels of education, Anglophones (outside Quebec) had higher average scores than Francophones (outside Quebec) in prose literacy. Average scores in prose literacy according to mother tongue and highest level of education completed, Canada without Quebec, population aged 16 and above, 2003. Études universitaires Source: IALSS, 2003 HRSD-Learning Policy Directorate
French minority in Ontario In Ontario, in prose literacy, Anglophones performed better than Francophones at all levels of education. People with a mother tongue other than English and French performed below level 3 at all levels of education. Average prose literacy proficiency scores according to mother tongue and highest level of education completed, population of Ontario 16-65, 2003. *Note that the estimated average scores for the group ‘English and French’ are not precise because of the small number of observations. Source: EIACA 2003 HRSD-Learning Policy Directorate
Sub-populations – Aboriginals In Manitoba and in Saskatchewan, the proficiency level in prose literacy of urban aboriginals was inferior by close to 10% to the level of proficiency of non-aboriginals. Comparative distributions of prose literacy proficiency by level, per cent of Aboriginal and non-Aboriginal populations in Manitoba and Saskatchewan, aged 16 and over, 2003 Source : IALSS, 2003. HRSD-Learning Policy Directorate
Subgroups – Aboriginal people Over half of the Aboriginal people in the Yukon, 69 % of the Aboriginal people in the Northwest Territories and 88 % of Inuit in Nunavut scored below level 3 in prose literacy Comparative distributions of prose literacy proficiency by level, per cent of Aboriginal and non-Aboriginal populations in the Northern Territories, aged 16 and over, 2003 Source: IALSS, 2003 HRSD-Learning Policy Directorate
Literacy performance and employment 62% of those at level 1 and 73% of those at level 2 in Ontario were employed. Per cent of employed population in each document literacy level, population 16 to 65, Canada and Regions, 2003 Source: IALSS, 2003 HRSD-Learning Policy Directorate
Literacy performance and employment In Ontario, unemployed people and people not in the labour force scored on average at level 2 in prose literacy, while employed people scored on average at level 3. Source: IALSS 2003 HRSD-Learning Policy Directorate
Low literacy and employment Persons with low prose literacy were concentrated among certain industries, Canada and Ontario. (Population 16-65) Total: 1,257,000 2,666,000 *These industries employed roughly 65% of the workers at levels 1 and 2 HRSD-Learning Policy Directorate Source: IALSS, 2003
Literacy performance- Occupation The majority of knowledge experts scored at Level 3 or above in prose literacy in the regions and the territories. Per cent of Labour force population at prose levels 3 and 4/5 by type of occupations, population 16 to 65, Canada and regions, 2003 Source: IALSS, 2003 HRSD-Learning Policy Directorate
Literacy performance- Occupation Workers in knowledge-related occupations tended to engage more often in writing at work than do low-skill information, services and goods production workers. Index scores of writing engagement at work on a standardized scale (centered on 2) by aggregated occupational types, labour force population, 16 to 65, 2003 Legend Occupation Types 1 Knowledge expert 2 Managers 3 Information high-skills 4 Information low-skills 5 Services low-skills 6 Goods Source: IALSS, 2003 HRSD-Learning Policy Directorate
Literacy performance- Industry All industrial sectors in Ontario had at least 40% of their workers at level 3 or above in numeracy. Per cent of labour force population at numeracy levels 3 and 4/5, by type of industry, population 16 to 65, Canada and regions, 2003 Source: IALSS, 2003 HRSD-Learning Policy Directorate
Literacy performance-Labour force Canadians with higher average scores earned more Source: IALSS, 2003 HRSD-Learning Policy Directorate
Subgroups - Immigrants A signficantly higher proportion of immigrants had low literacy compared to their Canadian-born counterparts, and the proportion did not vary by their length of stay in Canada Distribution of recent immigrant, established immigrant and native born populations by level of Prose performance, ages 16-65, Canada, 2003 10 years or less More than 10 years Canadian born Source: IALSS, 2003 HRSD-Learning Policy Directorate
Subgroups - Immigrants The literacy performance of immigrants was higher among those with mother tongue the same as the language of test (population 16-65) Source: IALS, 2003 HRSD-Learning Policy Directorate
Literacy performance- Immigrants in Canada Regardless of their level of literacy proficiency, most immigrants were employed but were they under employed? Source: IALSS, 2003 HRSD-Learning Policy Directorate
Literacy performance- Immigrants in Canada A high number of immigrants at levels 1 and 2 proficiency in English or French have post secondary education. Source: IALSS, 2003 HRSD-Learning Policy Directorate
Literacy performance- Adult training participation In all provinces and territories there was a substantial difference between the participation rates in training of those with the lowest and highest levels of literacy. Per cent of population receiving adult education and training during the year preceding the interview, by document literacy levels, 16-65, Canada and regions, 2003 Source: IALSS, 2003 HRSD-Learning Policy Directorate
Literacy performance- Adult training participation About 50% of workers participated in adult training in Ontario, the same as in Canada. Also a smaller proportion (22%) of workers took courses in Ontario compared to Canada (25%). Per cent of population receiving adult education and training the year preceding the interview, by type of participation, population 16 to 65, Canada, provinces and territories, 2003 Source: IALSS, 2003 HRSD-Learning Policy Directorate
Literacy performance-ICT 79% of Ontario residents had access to a computer at home compared to 76% of Canadians aged 16 to 65 years. Computer and Internet access at home Per cent of adults aged 16-65 who report having access to a computer and the Internet at home, Canada, provinces and territories, 2003 Source: IALSS, 2003 HRSD-Learning Policy Directorate
Literacy performance- Health Generally, 16 to 65 year-olds in poor health had lower average document literacy scores. Physical Component Summary (PCS) scores by mean document literacy proficiency by age groups, Canada, provinces et territoires, 2003 Note : Orders the provinces and territories by the size of the difference in average document literacy between those in poor health and those in excellent health. Source: IALSS, 2003 HRSD-Learning Policy Directorate
Improving Literacy in Ontario Policy sensitive targets appear to be similar for Ontario and Canada. Regression analysis. Base group: -26-45 -Those with high school -Mother tongue English 16-25 46-65 Less than high school Postsecondary Mother tongue other than English or French Mother tongue French Source: IALSS 2003 HRSD-Learning Policy Directorate
Geographic distribution of people at levels 1 and 2 in prose in Ontario (IALSS population 16-65). Source: IALSS 2003 HRSD-Learning Policy Directorate
Geographic distribution of people at levels 4 and 5 in prose in Ontario (IALSS population 16-65). Source: IALSS 2003 HRSD-Learning Policy Directorate
Geographic distribution of people at levels 1 and 2 in prose in Southern Ontario (IALSS population 16-65). HRSD-Learning Policy Directorate
Geographic distribution of people at levels 1 and 2 in prose in Toronto (IALSS population 16-65). HRSD-Learning Policy Directorate
Contact Information: Satya Brink, Ph.D. Director, Policy Research Learning Policy Directorate Human Resources and Skills Development Canada Place du Portage, Phase IV, 3 Floor 140 Promenade du Portage Gatineau, QC K1A 0J9 Tel: 819-953-6622 Fax: 819-997-5433 Satya.Brink@hrsdc-rhdcc.gc.ca HRSD-Learning Policy Directorate
Invest in your future… Build on your strengths… HRSD-Learning Policy Directorate