Download

1 / 41
650 likes | 1.22k Views
Cohort Studies. X. X. X. X. X. X. X. X. X. X. X. X. Compare incidence. Cohort Study. Follow up studies Longitudinal studies Incidence studies. Identify non-diseased people; group by risk factor status. Follow longitudinally to compare incidence. Compare past exposures.

E N D
X X X X X X X X X X X X Compare incidence Cohort Study • Follow up studies • Longitudinal studies • Incidence studies Identify non-diseased people; group by risk factor status Follow longitudinally to compare incidence. Compare past exposures Case – Control Study Find cases with disease & non-disease controls. Compare their past exposures.
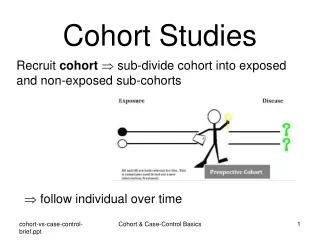
X X X X • Start with non-diseased people. • Group by exposure status. • Compare incidence of disease. Key Features of Cohort Studies Exposed Compare Incidence Time passes Non-diseased initially Not Exposed
In prospective cohort studies conception, design, & enrollment occur before anyone develops the outcome. Enroll non-diseased subjects; collect baseline exposure data X X Obese Follow up at intervals to get accurate outcome data. X Compare incidence X Lean Identify a cohort retrospectively, e.g. employees at a tire factory. X X Exposed to chemicals Determine what then happened to them. X Compare incidence X Non-exposed office workers
A randomized clinical trial is similar to a prospective cohort study. The investigators assign subjects to a treatment or intervention. Aspirin X Compare incidence over time X X Placebo X
Kiddy Pool No Kiddy Pool Club Members Had factor Didn’t have factor Compare Incidence Start of Study Past During the short time course of this study fairly reliable data was collected by interviews with club members.
Tire makers Clerical staff Employees of tire manufacturer Had factor Didn’t have factor Compare Incidence of Death Start of Study Past During the long time course of this occupational study data on exposure was from employee records and there was little information on other confounding factors.
X-Ray therapy Other therapy Patients with ankylosing spondylitis Had factor Didn’t have factor Compare Incidence of Cancer Start of Study Past During the long time course of this medical study accurate data on exposure was obtained from medical records, but accurate information about smoking, alcohol consumption, BMI, & occupational exposures was missing.
Data Sources for Retrospective Cohort Studies • Questionnaires • Employee records • Medical records Retrospective cohort studies are useful for unusual exposures and they are efficient for diseases with long latent periods (time between exposure & disease). However, accurate information on the main exposure and confounding factors is often missing because the data source was not designed for the purpose of conducting the study.
Similar in Design & Analysis • Retrospective Cohort • Prospective Cohort • Clinical Trial • You can collect data in a spreadsheet. • Organize findings in a 2x2 table (or R x C). • Calculate RR, RD, AR% • Test for significance with chi square. • Compute 95% confidence interval for RR.
Recording the data for analysis: A table with subjects in rows. Exposures and outcomes are listed in columns.
Analysis of Retrospective Cohort Studies Given the assumption that exposure status is fixed and the lack of periodic follow up, it makes sense to compare cumulative incidence.
In kiddy pool Not exposed 12.9% Relative Risk = = 3.3 ( 1.7-6.5) 3.9% Got Giardiasis Cumulative Incidence Yes No 12.9% 16 108 124 Yes 3.9% No 14 341 355 P value = 0.0003
obese lean Prospective Cohort Study The Cohort 117,000 Nurses without cancer or CVD Have risk factor Don’t have it Compare Incidence of disease Start of Study Future Follow-up A major advantage of prospective cohort studies is that they are carefully designed with specific goals in mind. Therefore, information on baseline exposures can be carefully collected on all subjects before anyone has an “event”.
Potential Sources of Data in a Prospective Cohort Study • Interviews • Questionnaires • Biological specimens (blood, urine, toenails, hair) • Imaging studies (x-ray, ultrasound, CT, etc.) • Medical records (verifying outcomes such as myocardial infarction, stroke, cancer, etc.) Data collected specifically for a prospective cohort study will be of higher quality than that obtained from pre-existing records, but it is more expensive to do a large, prospective cohort study.
Potential Problems • Exposure status may change. What if some women lost or gained a substantial amount of weight during the period of study? What if smokers quit? • Loss to follow up. • If follow up is over many years, subjects may loose interest and quit. These problems can be overcome by taken steps to minimize loss to follow-up and by careful periodic follow up with re-assessment of exposure status.
x= when they got disease Time at Risk 8.3 x 11.0 14.0 14.0 10.2 x 3.0 12.0 7.0 10.0 3.0 9.0 x 6.2 Total time at risk =107.7 person-yrs Incidence Rate For Variable Follow-up in A Prospective Cohort Study Subject A- B- C- D- E- F- G- H- I- J- K- L- 81 82 83 84 85 86 87 88 89 90 91 92 93 94 95 Incidence (IR) = 3/107.7 = .028/ person-yr = 28/1000 p-yrs
Relative Risk 1.0 41 177,356 23.1 1.3 57 194,243 29.3 1.6 56 155,717 36.0 2.0 67 148,541 45.1 3.7 85 99,573 85.4 Risk difference = 62.3 excess cases /100,000 P-Yrs Nurses Health Study Is obesity associated with an increased risk of heart disease? MI Rate per 100,000 P-Yrs (incidence) # MIs (non-fatal) person-years of observation BMI: <21 21-<23 23-<25 25-<29 >29
Another Unusual Risk Factor Veterans’ Problems after Viet Nam: • Skin rashes • Psychological problems • Infertility • Liver abnormalities • Cancers Agent Orange
Goals of the Agent Orange Study Look at a single, unusual exposure. Look at multiple possible effects.
An Ambi-directional Cohort Study The “Ranch Hand” study looked at effects of Agent Orange • 1,264 pilots who sprayed dioxin in Vietnam • 1,264 pilots who flew only cargo missions in Vietnam Prospective part Retrospective part Incidence of cancer? Exposed Unexposed Incidence of skin rash? Start of Study
Why were pilots flying only cargo missions an appropriate comparison groups?
A cohort study can look at multiple effects of a single exposure. Skin Disease Liver Abnormalities Yes No Psychological Problems Yes No Cancer Yes Yes No 139 Agent Orange 119 Yes No 169 217 10,820 No 239 3 98 138 227 10,807 Subjects grouped by risk factor status
Conclusions from the Ranch Hand Study Exposure to dioxin was associated with a significant increase in risk of soft tissue sarcoma, non-Hodgkin's lymphoma, and Hodgkin's disease. There was suggestive, but not statistically significant evidence of an association with respiratory cancers, prostate cancer, and multiple myeloma.
Selecting Subjects for a Cohort Study • Common risk factors (obesity, HBP): • A cohort from the general population: • (e.g., Framingham Heart Study) • A special study group: doctors, nurses • (e.g. The Nurse’s Health Study) • Unusual risk factors: • A special exposure group: • (e.g., tire manufacturing, dioxin, asbestos)
The Comparison Group 1) As similar as possible with respect toother factors that could influence outcome. 2) Comparable & accurate information. Where does the comparison group come from? Ideally, from within the cohort (internal controls), but this is not always possible.
Tire makers Clerical staff Problems with the Comparison Group Subjects may switch exposure status or become lost to follow up (quit) An Open Cohort Employees of tire manufacturer Had factor Didn’t have factor Compare Incidence of Death Start of Study Past What are the strengths and weaknesses of using clerical employees as the comparison group?
Tire makers Clerical staff Problems with the Comparison Group Subjects may switch exposure status or become lost to follow up (quit) An Open Cohort Employees of tire manufacturer Had factor Didn’t have factor Compare Incidence of Death Start of Study Past The clerical staff may be much less exposed to the chemicals, but there may be important differences in confounding factors such as gender, age, socioeconomic status, education, diet, smoking, alcohol consumption, etc.
Heaviest Nurses Leanest Internal Control Group Incidence of heart disease? The best comparison group is an unexposed or “least exposed” subset of the study cohort.
Rubber Workers General Population General Population Control The general population is often used in occupational studies of mortality, since data is readily available, and they are mostly unexposed. Some data sets allow adjustment for age, gender, SES, and race. vs. Mortality Rates? The main disadvantage is bias by the “healthy worker effect.” The employed work force (mostly healthy) generally has lower rates of mortality and disease than the general population (with healthy & ill people).
Rayon Factory Workers Paper Mill Workers A Comparison Cohort Exposed to disulfide Incidence of heart disease? vs. No disulfide exposure Both groups consist of blue collar workers, minimizing differences in SES, education, etc. The “healthy worker effect” is also not a factor. However, the paper mill workers may have other exposures that affect heart disease.
A strength is that cohort studies are efficient for unusual exposures. • Suspicion that occupational exposure to chemicals in tire manufacturing increase risk of death. • Viet Nam veterans with a variety of health problems. Was Agent Orange responsible? • Does x-ray treatment of ankylosing spondylitis (back problem) increase the risk of cancer? • The need for a better understanding of behavior modifications that can prevent cancer & heart disease (e.g., smoking & obesity). However, cohort studies also provide high quality information for examining common exposures as well.
Apparent RR = 1.0 True RR = 2.0 Bias From Loss To Follow-up If subjects in one of the exposure groups are more likely to be lost to follow up if they develop the outcome, then the estimate of association will be biased. OC Users Non-OC users Example: True incidence of thromboembolism: Subjects lost to follow up: 4,012 4,008 Subjects with TE lost to follow up: Apparent incidence of TE: 20/10,000 10/10,000 12 2 8/5,988 8/5,992 Can occur in cohort studies & intervention trials. Effects: over- or under- estimate of association.
Maintain Follow Up • Choose subjects who are motivated • Choose subjects who are easy to track (professionals) • Keep them interested: newsletters, incentives, part of the “family” • Frequent phone calls • Make questionnaires easy to fill out
Temporal sequence between exposure & disease is clear (e.g., obesity preceded CHD) Can directly calculate incidence, RR, RD, AR% Efficient for looking at rare exposures or unusual risk factors (e.g. agent orange). Can evaluate multiple effects of a single exposure. Advantages of Cohort Studies: Both Retrospective & Prospective: • Prospective cohort studies: • Provide better information on exposures. • Are less vulnerable to bias because exposure status is determined before outcomes. • Retrospective cohort studies: • Efficient for diseases with long latent period (time from exposure to development of disease).
Enroll non-diseased subjects; collect baseline exposure data Follow up at intervals to get accurate outcome data. Obese Lean X X X X X X X X Compare incidence Compare incidence over time • Better information on exposures. • Less vulnerable to bias because exposure status is determined before outcomes. Identify a cohort retrospectively (e.g. tire manufacturing workers vs. desk employees. Look at what subsequently happened to them. Exposed Not Exposed • Efficient with long latent period from exposure to development of disease).
Disadvantages of Cohort Studies • Inefficient for rare outcomes (both). Prospective Cohort Study • May need large numbers of subjects for long periods of time. • Can be expensive and time consuming. • Inefficient for diseases with long latent periods. • Loss to follow up can bias results. • Retrospective Cohort Study • Poor information on exposures & confounding factors. • More vulnerable to bias.
Enroll non-diseased subjects; collect baseline exposure data Follow up at intervals to get accurate outcome data. Obese Lean X X X X X X X X Compare incidence Compare incidence over time • Expensive and time consuming. • Inefficient for diseases with long latency. • Loss to follow up can bias results. Identify a cohort retrospectively (e.g. tire manufacturing workers vs. desk employees. Look at what subsequently happened to them. Exposed • Poor information on exposures & confounding factors. • More vulnerable to bias. Not Exposed
When reading a cohort study, consider… • How were the study groups selected or defined? • Did they differ in other ways that could affect the outcome? • Data collection: • Accurate? • Comparable for all groups? • How complete was the follow-up?