Download

1 / 30
350 likes | 416 Views
Cohort Studies. Introduction. All studies involve some descriptive or analytic type of comparison of exposure and disease status. Analytical study design options include: observational or interventional (which one is based on the role of the investigator) .

E N D
Introduction • All studies involve some descriptive or analytic type of comparison of exposure and disease status. • Analytical study design options include: observational or interventional(which one is based on the role of the investigator). • There are three basic types of observational analytical study designs: • Cohortstudies • Case-control studies • Cross-sectional studies
Introduction • Specific epidemiological study designs can be used to reveal etiologic (causal) relationships • First, using observational analytical studies : • Determine whether there is an association between a factor or a characteristic and the development of disease • Second: • From these associations, derive appropriate inferences regarding a possible causal relationship
Analytical Studies • Control and experimental groups • Randomized groups • data collected without bias • Dependent and independent factors
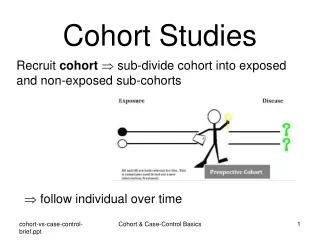
Cohort Studies • Group by common characteristics • Start with a group of subjects who lack a positive history of the outcome of interest yet are at risk for it (cohort). • Think of going from cause to effect. • The exposure of interest is determined for each member of the cohort and the group is followed to document incidence in the exposed and non-exposed members.
When is a cohort study warranted? • When good evidence suggests an association of a disease with a certain exposure or exposures.
Cohort Effect • Changes and variation in the disease or health status of a study population as the study group moves through time. • “Generation effect”
Types of Cohort Studies • Prospective(concurrent) • Retrospective(historical) • Restricted(restricted exposures)
Types of Cohort Studies • Prospective – cohort characterized by determination of exposure levels (exposed vs. not exposed) at baseline (present) and followed for occurrence of disease in future • Groups move through time as they age • Retrospective - makes use of historical data to determine exposure level at some baseline in the past and then determine subsequent disease status in the present. • Restricted - limited exposure, narrow behavior (military, long shore men)
Prospective Studies • Also called • longitudinal • concurrent • incidence studies • Looking into the future • Example: • Framingham Study of coronary heart disease (CHD)
Design of a Cohort Experiment • The essential characteristic in the design of cohort studies is the comparison of outcome in an exposed group and a nonexposed group(or a group with a certain characteristic and a group w/o that characteristic). • A study population can be chosen by selecting groups for inclusion in the study on the basis of whether or not they were exposed
Selection of Cohort Groups • There are two basic ways to generate cohort groups. • Select a cohort (defined population) BEFORE any of its members become exposed or before the exposures are identified. • Select a cohort on the basis of some factor (e.g., where they live) and take histories (e.g., blood tests) on the entire population to separate into exposed and non-exposed groups. • Regardless of which selection approach is used, we are comparing exposed and non-exposed persons.
Design of a Prospective Cohort Experiment Major problem with a prospective cohort design is that the cohort must be followed up for a long period of time.
Framingham Study • Designed to study the effect of multiple factors on coronary heart disease (CHD): • age • hypertension • elevated blood cholesterol • tobacco smoking • increased physical activity • increase in body weight • diabetes mellitus
Framingham Study Design • Framingham, Massachusetts population was 28,000 • Study design called for a random sample of 6,500 • Enrollment questionnaire form targeted age range 30-59 years • No clinical evidence of atherosclerotic cardiovascular disease • Cohort re-examined every two years • Problems: white, middle class
Hypothetical Cohort Study Approach • Examine people over their life times for contraction of diseases. In meantime, ask questions concerning diet, lifestyle,habits, work, etc. • Take blood and do lab tests (as many as possible). • Do same tests every year for a period of years. • Interventional aspect: If positive findings occur, they refer you to a specialist. By screening, they may have prolonged a life.
Sampling Garbage in, garbage out • Valid, reliable surveys • Critical number of subjects • the more, the better • Randomize • random selection • random assignment • Rule out bias • For example, degree of accuracy with which subjects have been classified with respect to their exposure. • For example, individuals who are sick may be more likely to give the kind of responses that they believe the investigator wants to hear
Data Gathering • Person - to - person • Drop off questionnaire • Mailed to people • Telephone interview • Newsletter or magazine
Potential Biases in Cohort Studies • Information bias • Bias in estimation of the outcome • Bias from non-response • Bias from losses to follow-up • Analytic bias Your assignment: Describe and differentiate between these types of biases.
Advantages of Prospective Cohort Studies • Captive groups • Large sample sizes • Certain diseases or risk factors targeted • Can be used to prove cause-effect • Assess magnitude of risk • Baseline of rates • Number and proportion of cases that can be prevented
Advantages of Prospective Studies (cont’d) • Completeness and accuracy • Opportunity to avoid condition being studied • Quality of data is high • Considers seasonal and other variations over a long period • Tracks effects of aging process
Disadvantages of Prospective Cohort Studies • Large study populations required • not easy to find subjects • Expensive • Unpredictable variables • Results not extrapolated to general population • Study results are limited • Time consuming/results are delayed • Requires rigid design and conditions
Disadvantages of Prospective Studies (cont’d) • Subjects lost over time (dropouts) • Costs are high • Logistically demanding • Maintaining quality, validity, accuracy and reliability can be a problem
Survivorship Studies • Survivorship is the number of persons out of a study population who would survive until a certain time interval has been reached • Shows the chance that an event (such as death from cancer) will occur in successive intervals of time once a diagnosis has been made • Analysis yields a cumulative probability of surviving the projected time period • For infectious diseases, we use case fatality rate to assess survival • For chronic diseases, we use cohort life tables
(Cohort) Life Tables • Charts which summarize the patterns of survival and death in study groups of certain types of disease (chronic) • Insurance companies study these charts very closely.
Survival curves and risk of death for males vs. females based on life tables in California for 1980. • Dip at beginning of life is due to infant mortality rate. • As one reaches the later years of life, the survival curve goes down and the risk of death goes up.
Is the Association Causal? To be continued…