Download
1 / 60
1.55k likes | 4.23k Views
Corrosion Measurement Techniques. A copy of this presentation is available in the CAL group in the computers in the Teaching Lab, or via the WWW at http://www.cp.umist.ac.uk/CPC/L_Notes. Corrosion Measurement Techniques. Polarization curves. Linear Polarization Resistance.

E N D
Corrosion Measurement Techniques A copy of this presentation is available in the CAL group in the computers in the Teaching Lab, or via the WWW at http://www.cp.umist.ac.uk/CPC/L_Notes
Corrosion Measurement Techniques • Polarization curves • Linear Polarization Resistance • Open Circuit Potential Decay • AC Impedance Measurement • Electrochemical Noise Measurement • Weight Loss Measurement
Polarization Curves • Measurement methods • Cell design • Plotting data • Interpretation
Measurement Methods • Objective • determine current density under steady-state conditions as a function of potential • not really practical, as this would strictly require one sample for each potential • therefore compromise on ‘closeness’ to true steady-state
Potentiostat AE RE WE Measurement Methods Connect electrodes to corresponding terminals on potentiostat • Potential control Reference Electrode - reference connection for potential measurement Luggin Probe - allows potential to be detected close to metal surface Counter Electrode (or Auxilliary Electrode or Secondary Electrode) - provides current path into solution Working Electrode - metal being studied Potentiostat controls potential
Current path V Potentiostat AE RE WE R Measurement Methods • Current control Counter Electrode Reference Electrode - only used to monitor potential, not connected to potentiostat Current controlled by control of voltage across resistor (I=V/R) Working Electrode Luggin Probe still needed to limit IR error
Measurement Methods • Swept potential or current • Use sweep generator to produce slowly changing potential • Sweep generator output controls potentiostat • Record response on chart recorder (or use computer monitoring) • Swept current not often used, as it moves through corrosion potential very quickly
Measurement Methods • Potential or current step • Step potential or current from one value to the next, allowing time to stabilise at each new value • Record current or potential • May be manually controlled, or use computer to step potential/current and take readings
Measurement Methods • Sweep direction • Aim to perform experiment in such an order that the initial polarization affects subsequent results as little as possible • Options • new specimen for each potential • one specimen for cathodic polarization, and one for anodic, both start at corrosion potential • one specimen, sweep from cathodic to anodic
Measurement Methods • Sweep rate (or step rate) • Ideal, all measurements made at steady-state • Time-dependent effects include: • Charging of double layer capacitance (I = C dV/dt) • Mass transport effects (t L2/D) • Adsorbed species and surface films (Faraday’s Law) • Typical sweep rates are of the order of 1 mV/s or less
Questions • Consider the corrosion of iron in aerated neutral solution, with the following parameters: • Cdl = 35 F / cm2 DO2 = 1.2 x 10⁻⁵ cm2 /s • Boundary layer thickness, = 100 m • Number of iron atoms on surface 21019/cm2 • Charge on the electron = 1.6 x 10⁻¹⁹C • Calculate • Capacitive current at 1 mV/s • Characteristic diffusion time • Limiting current density for O2 reduction (8 ppm O2) • Time to oxidise Fe surface to FeOH (Fe+) at ilim
Cell Design • Working electrode • Reference electrode • Counter electrode • Solution • Mass transport
Working Electrode • Requirements • reproducible • representative • free of crevices • free of edge effects • free of galvanic effects • free of water-line effects
Working Electrode • Epoxy embedded electrode: Apply thin layer of epoxy to minimise stress and risk of crevice formation Weld or solder connecting wire to specimen Apply thick layer of epoxy to seal connecting tube and for strength Pretreat specimen for good adhesion Carefully grind surface to expose metal Clean surface - don’t use acetone
Metal rod Retaining nut Washers Heavy-walled glass tube PTFE Washer Electrode Working Electrode • Stern-Makrides electrodes: Lip sealbetween PTFE case and electrode
NaClSolution PureH2O feed Filter paper Specimen Working Electrode • Avesta cell:
Reference Electrode • Commonly use Saturated Calomel Electrode (SCE) • Properties may degrade with time (and misuse) • check one against another (should not be more than 1 to 2 mV difference) • do not pass current through the reference electrode (e.g. do not connect to working or counter electrode) • do not allow to dry out
Reference Electrode • Solution in SCE (or Ag/AgCl electrode) is saturated KCl • beware of chloride contamination of test solution by Cl- leaking from reference electrode • make sure solution remains saturated
Luggin Probe • A Luggin probe should be used whenever there is a significant current applied to the electrode Electrode Luggin probe allows point at which potential is measured to be close to electrode surface (around 3 times tip diameter is best)
Counter electrode • Counter electrode should allow current to pass with tolerable polarization • Often claimed that counter electrode should have much larger area than working electrode, but this is not often necessary for corrosion studies • Usually use platinum or graphite, although stainless steel can be used in some situations (e.g. where only anodic polarization of specimen is used)
Solution • Requirements: • as high a conductivity as possible (add supporting electrolyte, such as sodium perchlorate?) • remain the same (pH, composition) throughout the experiment - ensure that volume is adequate • oxygen concentration often critical - aerate by bubbling air or O2 or deaerate with N2 or Ar • most reactions temperature sensitive, so control, or at least record, temperature
Mass transport • Methods of controlling mass transport • rotating disk or cylinder • flow channel • jet impingement • gas bubbling
Plotting of Polarization Curves • Comparison of log-i and linear-i plots • Identification of anodic and cathodic regions on log-i plots • Orientation of plots
E log |I| - old plotting method E log |i|
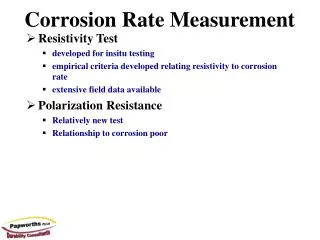
Interpretation of Polarization Curves • Addition of reactions on log-I graphs • Tafel regions • Mass transport control • Active-passive transition • Transpassive corrosion • Pitting Corrosion
Tafel regions • A Tafel region is a straight line in the E-log|i| plot • For a reliable Tafel slope: • the line should be straight for at least one decade (in this context a decade implies a change of current density by a factor of ten, i.e a difference of 1 in log i ) • the region should be next to Ecorr
Tafel Extrapolation • Extrapolate anodic or cathodic Tafel region, or both, back to Ecorr, when the current density is icorr • In aerated neutral solutions, where mass transport limited oxygen reduction is the main cathodic reaction, the cathodic reaction does not have a valid Tafel slope, but the anodic slope can sometimes be used
Question • How can we estimate the rate of hydrogen evolution during free corrosion? • Estimate the value for the graph shown.
Mass transport control • When the supply of a reactant becomes mass transport controlled, we observe a limiting current density • The most common case occurs for oxygen as a cathodic reactant in neutral solutions • NOTE - the diffusion of a reaction product away from the electrode will not affect the rate of the forward reaction
Solution Resistance Effects • At high currents the potential drop associated with the solution resistance can be significant • It is generally referred to as an IR error • Gives a straight line on E-i plots
E log |i| Active-passive transition • As a passive film develops, it covers the surface and shuts off the dissolution reaction, leading to an active-passive transition
E log |i| Active-passive transition • For stainless steel we sometimes see two active-passive transitions, on for Chromium, and one for Iron
Transpassive corrosion • A passive metal (notably Cr and Fe) may start to dissolve at a very positive potential when a higher oxidation state (e.g. Cr6+ as chromate) is formed • This is known as transpassive corrosion, and will give something like a second activation-controlled reaction • For alloys the behaviour will be complicated by the differing behaviours of the alloy components
Anodic Polarization Curve for Stainless Steel Activation-controlled dissolution Active-passive transition Active peak for iron Transpassive corrosion of Cr Oxygen reduction Overall anodic curve E log |i|
Pitting Corrosion • Pitting shows up as an increasing anodic current before (at a less positive potential than) transpassive corrosion or oxygen evolution, usually preceded by noise • E-log|i| plot does not follow same path if scan direction is reversed, but current is greater (since pit continues to grow)
Pitting Corrosion Noise spikes due to meta-stable pitting Current continues to increase after reversal of scan Pit eventually re-passivates E log |i|
What is going on? Stainless Steel in Aerated Sulphuric Acid Anodic Cathodic E Anodic Cathodic log |i|
Linear Polarization Resistance Measurement • Theoretical basis • Measurement methods • Interpretation
LPRM Theory • For an activation controlled reaction Exchange current density Equilibrium potential Tafel slope based on exponential (i.e. mV for a change of 1 in ln(i))
LPRM Theory • Summing for two reactions • Rearrange and convert to b rather than Anodic partial current density (=icorr) Because c is taken as negative Anodic Tafel slope (positive) Cathodic Tafel slope (negative) Cathodic partial current density (= -icorr) Tafel slope based on a decade change in current (i.e. a change of 1 in log i ) Stern-Geary coefficient
LPRM Measurement Methods • Control variable • Waveform • Cell configuration • Sweep rate
LPRM Control Variable • Potential control • potential range can be optimised • problems with drift of Ecorr • Current control • potential range depends on Rp • measurement inherently centred about i = 0
LPRM Measurement Waveform • Triangle wave • can measure di/dt at i = 0 • requires relatively complex instruments • Square wave (switch between +i and -i) • simple instruments • simple to automate • Sine wave • simplest theory for frequency effects • complex to perform measurement
LPRM Cell Configuration • Two electrode • assume Rp is the same for two similar electrodes and measure cell resistance (= 2Rp + Rsol) • easy, no reference electrode required • Three electrode • use conventional counter, reference and working electrodes • provides lower solution resistance, therefore better for low conductivity solutions • more complex instrumentation


![[TC]²: Redefining Measurement Techniques](https://cdn4.slideserve.com/8405313/tc-redefining-measurement-techniques-dt.jpg)