Download
1 / 5
50 likes | 52 Views
Review measures of center and spread, create a histogram of data, and understand how a histogram represents chance by area. Learn how the histogram of observed sums approximates a normal curve, and how to calculate probabilities using probability histograms. Examples provided.

E N D
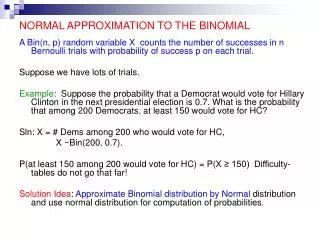
Ch.18 Normal approximation using probability histograms • Review measures center and spread • List of numbers (histogram of data) • Box model • For a “large” number of draws, a histogram of observed sums is like a normal curve.
A probability histogram represents chance by area. • The value in the middle of the base of the rectangle represents the sum. • The area of the rectangle equals the chance of getting that particular sum. • Example 1: Coin toss 4 times and count the number of heads. What is the probability of getting exactly 2 heads? What is the probability of getting 2 or fewer heads?
Activity • Probability Histogram • Empirical Histogram
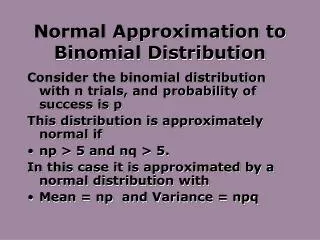
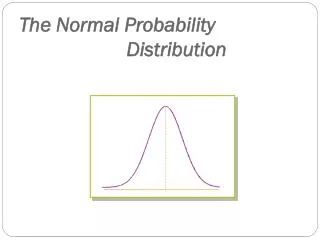
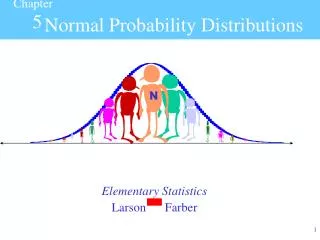
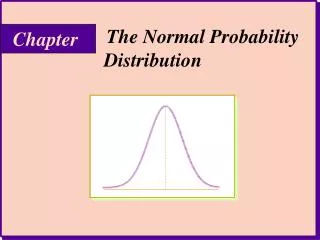
If the number of repetitions is large, the histogram for the observed sums (data) is approximately the probability histogram. (Law of averages) • If the number of draws is large (with replacement), the probability histogram for the sum of the draws is approximately the normal curve. (Central limit theorem)
Example 2: What is the chance of getting exactly 50 heads in 100 coin tosses? • Example 3: Using the setting from the probability histogram activity, what is the chance of getting a sum of 3 in 2 draws?