Download
1 / 25
260 likes | 360 Views
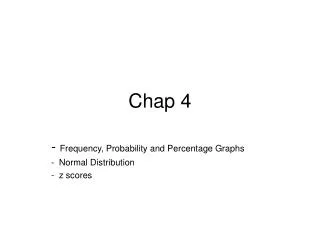
Chap 4. The Normal Approximation. Unit Transformation The Normal Distribution Curve Areas under the Normal Curve The Normal Approximation for Data Percentiles Interquartile and Box Plot Percentiles and the Normal Curve. Unit Transformation. The Normal Distribution Curve. Percentiles.

E N D
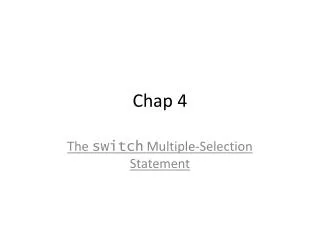
Chap 4. The Normal Approximation Unit Transformation The Normal Distribution Curve Areas under the Normal Curve The Normal Approximation for Data Percentiles Interquartile and Box Plot Percentiles and the Normal Curve
Unit Transformation The Normal Distribution Curve Percentiles Interquartile and Box Plot 1 2 3 4 5 6 7 Areas under the Normal Curve INDEX The Normal Approximation for Data Percentiles and the Normal Curve
1. Unit Transformation Unit Transformation • A transformation which adds a constant or multiply by a constant to a measurement value. • Standardization is a kind of unit transformation which subtracts average and divide by SD.
1 2 3 4 5 6 7 -1.5 –1 –0.5 0 0.5 1 1.5 10 13 16 19 22 25 28 1. Unit Transformation Unit Transformation Standardization The shape of distribution is indifferent to the unit.
Unit Transformation The Normal Distribution Curve Percentiles Interquartile and Box Plot 1 2 3 4 5 6 7 Areas under the Normal Curve INDEX The Normal Approximation for Data Percentiles and the Normal Curve
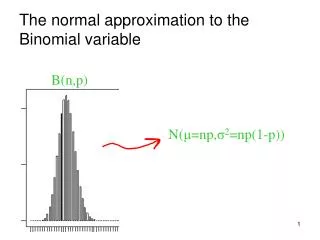
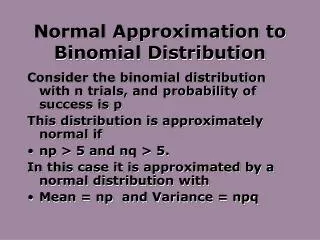
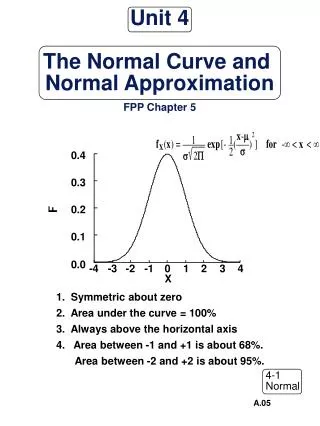
2. The Normal Distribution Curve Normal Distribution Curve • The normal distribution is an ideal histogram. This is a mathematical model approximating the distribution of the real data and is a distribution of population. • is population mean and is population standard deviation
2. The Normal Distribution Curve Standard normal distribution the area under the standard normal curve between -1 and +1 : about 68% between -2 and +2 : about 95% between -3 and +3 : about 99.7% • Among normal distributions, satisfying E(X)=0, SD(X)=1
2. The Normal Distribution Curve A histogram for heights of women compared to the normal curve
Unit Transformation The Normal Distribution Curve Percentiles Interquartile and Box Plot 1 2 3 4 5 6 7 Areas under the Normal Curve INDEX The Normal Approximation for Data Percentiles and the Normal Curve
3. Areas under the Normal Curve Finding areas under the normal curve (I) Standard normal • Use the standard normal distribution table. 0 z The area between 0 and 1 is 34.13%
= + -2 1 -2 0 0 1 3. Areas under the Normal Curve Finding areas under the normal curve(II) • Find the area between -2 and 1 under the standard normal distribution curve. ☞ the area between -2 and 0 is the same as the area between 0 and 2, by symmetry ☞ the area of it is about 48% and the area between 0 and 1 is about 34% ☞ so the area between -2 and 1 is about 48%+34%=82%
Unit Transformation The Normal Distribution Curve Percentiles Interquartile and Box Plot 1 2 3 4 5 6 7 Areas under the Normal Curve INDEX The Normal Approximation for Data Percentiles and the Normal Curve
4. Normal Approximation for Data The Average and SD • By the center and the spread around the center, the average and SD summarize a histogram which follows the normal curve. The average and SD are good summary for a histogram.
-2 0 +1 4. Normal Approximation for Data Normal approximation ☞ convert to standard units (from -2 to 1) ☞ find the area above the shaded standard-units interval ☞ about 82% (exactly 83.2%) Ex) What is the ratio of the men whose heights are between 150.4cm and 176cm ? 167.5cm 176cm 150.4cm standardization - 2 0 +1 Sketch in the standard normal curve
Unit Transformation The Normal Distribution Curve Percentiles Interquartile and Box Plot 1 2 3 4 5 6 7 Areas under the Normal Curve INDEX The Normal Approximation for Data Percentiles and the Normal Curve
0.05 0.04 0.03 0.02 0.01 0 0 2,000 4,000 6,000 8,000 10,000 12,000 5. Percentiles Histogram for families by income • Not all the histograms follow the normal curve. No one has negative incomes in the income histogram. But the normal approximation suggests that about 8% of the families had negative incomes. The histogram does not follow the normal curve at all well.
5. Percentiles Percentiles for family income • Percentiles are good summaries for such a histogram having a long tail. 10% of families had incomes of $7,436 or less, and 90% were above.
Unit Transformation The Normal Distribution Curve Percentiles Interquartile and Box Plot 1 2 3 4 5 6 7 Areas under the Normal Curve INDEX The Normal Approximation for Data Percentiles and the Normal Curve
6. Interquartile and box plot interquartile • interquartile the 25th, 50th and 75th percentiles are the 1st , 2nd and 3rd quartile. Especially, the 50th percentile is just the median and the 2nd quartile. • Interquartile Range (interquartile range)=(3rd quartile)-(1st quartile)
6. Interquartile and box plot • Five number summary for data: minimum, the 1st quartile, 2nd quartile, 3rd quartile, and the maximum • Box plot describes the five number summary • Two vertical lines of the box indicates the minimum and the maximum. • Three horizontal lines in the box indicates three quartiles. • Sometimes the 10% and 90% are used instead.
6. Interquartile and box plot Box plot (family income)
6. Interquartile and box plot Weekly profitability of firms in 2000 20 1 : KOSPI 2 : 삼성전자 3 : SK 텔레콤 4 : 한국전력 5 : 포항제철 6 : 현대차 7 : 기아차 8 : 신한은행 9 : 삼성전기 10 : 삼성증권 15 10 5 Weekly profitability(%) 0 -5 -10 -15 -20 1 2 3 4 5 6 7 8 9 10 종목
6. Interquartile and box plot Comparison of Samsung Electronics and POSCO 40 30 Samsung Electronics : from the minimum -26% to the maximum 37% 20 Weekly profitability(%) 10 0 The range of POSCO is smaller than that of Samsung -10 -20 -30 POSCO Samsung Firm
Unit Transformation The Normal Distribution Curve Percentiles Interquartile and Box Plot 1 2 3 4 5 6 7 Areas under the Normal Curve INDEX The Normal Approximation for Data Percentiles and the Normal Curve
7. Percentiles and Normal Curve Finding Percentiles • Ex) Estimate the score of the upper 5% at the midterm of statistics. (E(X)=27.93, Var(X)=8.522) ☞ when z =1.65, the size of [0,1.65] is 45% ☞ 1.65 * 8.52 = 14.06 ☞ 27.93 + 14.06 = 41.99 -0.19 13.87 27.93 41.99 56.05 Midterm score 1.65 0 Standard unit