Download

1 / 22
290 likes | 679 Views
Chapter 6.5. Normal Approximation to the Binomial. Normal Approximation to the Binomial. The probabilities associated with binomial experiments are readily obtainable from the formula b ( x ; n , p ) of the binomial distribution or from the table when n is small.

E N D
Chapter 6.5 Normal Approximation to the Binomial Normal Approximation to the Binomial • The probabilities associated with binomial experiments are readily obtainable from the formula b(x;n, p) of the binomial distribution or from the table when n is small. • For large n, making the distribution table is not practical anymore. • Nevertheless, the binomial distribution can be nicely approximated by the normal distribution under certain circumstances.
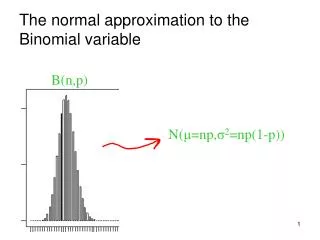
Chapter 6.5 Normal Approximation to the Binomial Normal Approximation to the Binomial • If X is a binomial random variable with mean μ = np and variance σ2 = npq, then the limiting form of the distribution of as n ∞, is the standard normal distribution n(z;0,1). • Normal approximation of b(x;15,0.4) • Each value of b(x;15,0.4) is approximated by P(x–0.5<X<x+0.5)
Chapter 6.5 Normal Approximation to the Binomial Normal Approximation to the Binomial • Normal approximation of and
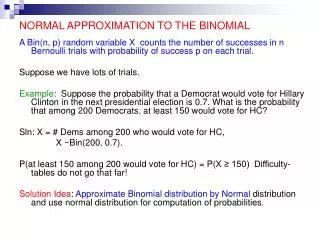
Chapter 6.5 Normal Approximation to the Binomial Normal Approximation to the Binomial • The degree of accuracy, that is how well the normal curve fits the binomial histogram, will increase as n increases. • If the value of n is small and p is not very close to 1/2, normal curve will not fit the histogram well, as shown below. • The approximation using normal curve will be excellent whenn is large or n is small with p reasonably close to 1/2. • As rule of thumb, if bothnp and nq are greater than or equal to 5, the approximation will be good.
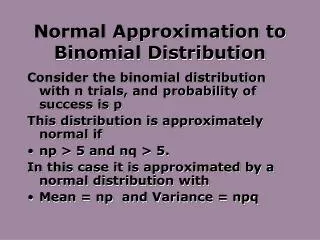
Chapter 6.5 Normal Approximation to the Binomial Normal Approximation to the Binomial • Let X be a binomial random variable with parameters n and p. For large n, X has approximately a normal distribution with μ = np and σ2 = npq = np(1–p) and and the approximation will be good if np and nq = n(1–p) are greater than or equal to 5.
Chapter 6.5 Normal Approximation to the Binomial Normal Approximation to the Binomial The probability that a patient recovers from a rare blood disease is 0.4. If 100 people are known to have contracted this disease, what is the probability that less than 30 survive? • After interpolation • Can you calculate the exact solution?
Chapter 6.5 Normal Approximation to the Binomial Normal Approximation to the Binomial A multiple-choice quiz has 200 questions each with 4 possible answers of which only 1 is the correct answer. What is the probability that sheer guess-work yields from 25 to 30 correct answers for 80 of the 200 problems about which the student has no knowledge?
Chapter 6.5 Normal Approximation to the Binomial Normal Approximation to the Binomial PU Physics entrance exam consists of 30 multiple-choice questions each with 4 possible answers of which only 1 is the correct answer. What is the probability that a prospective students will obtain scholarship by correctly answering at least 80% of the questions just by guessing? • It is practically impossible to get scholarship just by pure luck in the entrance exam
Chapter 6.6 Gamma and Exponential Distributions Gamma and Exponential Distributions • There are still numerous situations that the normal distribution cannot cover. For such situations, different types of density functions are required. • Two such density functions are the gamma and exponential distributions. • Both distributions find applications in queuing theory and reliability problems. • The gamma function is defined by for α>0.
Chapter 6.6 Gamma and Exponential Distributions Gamma and Exponential Distributions • |Gamma Distribution| The continuous random variable X has a gamma distribution, with parameters α and β, if its density function is given by where α>0 and β>0. • |Exponential Distribution| The continuous random variable X has an exponential distribution, with parameter β, if its density function is given by where β>0.
Chapter 6.6 Gamma and Exponential Distributions Gamma and Exponential Distributions • Gamma distributions for certain values of the parameters α and β • The gamma distribution with α=1 is called the exponential distribution
Chapter 6.6 Gamma and Exponential Distributions Gamma and Exponential Distributions • The mean and variance of the gamma distribution are and • The mean and variance of the exponential distribution are and
Chapter 6.7 Applications of the Gamma and Exponential Distributions Applications of Gamma and Exponential Distributions Suppose that a system contains a certain type of component whose time in years to failure is given by T. The random variable T is modeled nicely by the exponential distribution with mean time to failure β = 5. If 5 of these components are installed in different systems, what is the probability that at least 2 are still functioning at the end of 8 years? • The probability whether the component is still functioning at the end of 8 years • The probability whether at least 2 out of 5 such component are still functioning at the end of 8 years
Chapter 6.7 Applications of the Gamma and Exponential Distributions Applications of Gamma and Exponential Distributions Suppose that telephone calls arriving at a particular switchboard follow a Poisson process with an average of 5 calls coming per minute. What is the probability that up to a minute will elapse until 2 calls have come in to the switchboard? • β is the mean time of the event of calling • α is the quantity of the event of calling
Chapter 6.7 Applications of the Gamma and Exponential Distributions Applications of Gamma and Exponential Distributions Based on extensive testing, it is determined that the average of time Y before a washing machine requires a major repair is 4 years. This time is known to be able to be modeled nicely using exponential function. The machine is considered a bargain if it is unlikely to require a major repair before the sixth year. Determine the probability that it can survive without major repair until more than 6 years. What is the probability that a major repair occurs in the first year? • Only 22.3% survives until more than 6 years without major reparation • 22.1% will need major reparation after used for 1 year
Chapter 6.8 Chi-Squared Distribution Chi-Squared Distribution • Another very important special case of the gamma distribution is obtained by letting α = v/2 and β = 2, where v is a positive integer. • The result is called the chi-squared distribution, with a single parameter v called the degrees of freedom. • The chi-squared distribution plays a vital role in statistical inference. It has considerable application in both methodology and theory. • Many chapters ahead of us will contain important applications of this distribution.
Chapter 6.8 Chi-Squared Distribution Chi-Squared Distribution • |Chi-Squared Distribution|The continuous random variable X has a chi-squared distribution, with v degrees of freedom, if its density function is given by where v is a positive integer. • The mean and variance of the chi-squared distribution are and
Chapter 6.9 Lognormal Distribution Lognormal Distribution • The lognormal distribution is used for a wide variety of applications. • The distribution applies in cases where a natural log transformation results in a normal distribution.
Chapter 6.9 Lognormal Distribution Lognormal Distribution • |Lognormal Distribution|The continuous random variable X has a lognormal distribution if the random variable Y = ln(X) has a normal distribution with mean μ and standard deviation σ. The resulting density function of X is • The mean and variance of the chi-squared distribution are and
Chapter 6.9 Lognormal Distribution Lognormal Distribution Concentration of pollutants produced by chemical plants historically are known to exhibit behavior that resembles a log normal distribution. This is important when one considers issues regarding compliance to government regulations. Suppose it is assumed that the concentration of a certain pollutant, in parts per million, has a lognormal distribution with parameters μ = 3.2 and σ = 1. What is the probability that the concentration exceeds 8 parts per million? • F denotes the cumulative distribution function of the standard normal distribution • a.k.a. the area under the normal curve
Probability and Statistics Homework 8A (a) Suppose that a sample of 1600 tires of the same type are obtained at random from an ongoing production process in which 8% of all such tires produced are defective. What is the probability that in such sample 150 or fewer tires will be defective?(Sou18. CD6-13) (b) If 10% of men are bald, what is the probability that more than 100 in a random sample of 818 men are bald?