Download
1 / 27
330 likes | 659 Views
Standard Normal Distribution. Using the Standard Normal Table & Z-Scores. Vocabulary. Mean = µ (same calculation as x ) Probability/Proportion/Percent Percentile Standard Deviation = σ (it is a population) Standard Normal Distribution Standard Normal Table Z-Score.

E N D
Standard Normal Distribution Using the Standard Normal Table & Z-Scores
Vocabulary • Mean = µ (same calculation as x ) • Probability/Proportion/Percent • Percentile • Standard Deviation = σ (it is a population) • Standard Normal Distribution • Standard Normal Table • Z-Score
Standard Normal Distribution • Recall that the Standard Normal Distribution is symmetrical, and the mean, median and mode are equal. • We know how to calculate probability for standardized data if the observation (x) is exactly 1, 2, or 3 standard deviations from the mean using the Empirical Rule… BUT….
What if you want to be more precise? • If the observed data (x) is not EXACTLY ±1σ, ±2σ, or ±3σ from the mean, we can only estimate using the Empirical Rule. • To be more precise, NORMAL CALCULATIONS allow us to find exactly how many standard deviations the observation is from the mean. • Then we can use a Standard Normal table to find the probability of that specific observation occurring.
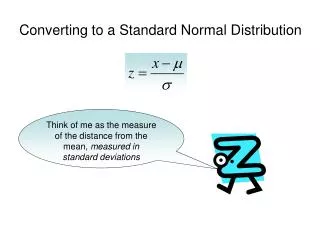
Z-Scores • To use the Standard Normal Table, we must calculate how many standard deviations the data is from the mean. • We calculate the standardized value of x, called a “Z-Score”.
What Does A Z-Score Tell Us? • How many standard deviations away the original observation (x) is from the mean (µ). • If z ≥ 0, the observation is greater than µ • If z ≤ 0, the observation is less than µ • Note that if z = 0, the observation = µ
Using a Z-Score and the Standard Normal Table • Example: Z = 2.36 • Step 1: Locate the row that corresponds to the 1st number & 1st decimal place of the Z-Score (e.g., 2.36) • Step 2: Find the column that corresponds to the 2nd decimal place (e.g., in this case .06) • Step 3: Find where the row and column intersect. THIS is the proportion of data that falls at or below the observed data (in this case, 0.9909. • Step 4: Multiply the proportion value by 100% to get a percent (e.g., 99.09%).
The scores for all high school seniors taking the verbal section of the Scholastic Aptitude Test (SAT) in a particular year had a mean of 490 and a standard deviation of 100. The distribution of SAT scores is normal. One student scored 795 on this test. What proportion of students scored at or below 795 on the test? First, we need to standardize the score of 795. In doing so, we see that this student scored 3.05 standard deviations above the mean of 490.
The Standard Normal Distribution This is part of a standard Normal table that you should be able to read. Since our particular problem deals with a z-score of 3.05, we should go to the last row (3.0) and over to the appropriate column (0.05). We should see that they meet at 0.9989. This is the proportion TO THE LEFT of our score (of 795). So 99.89% of all students scored at or below 795 on the SAT.
This z-score shows a proportion of .7486 (or 74.86%). So, the number of students = .7486 * 625 students = 467.875 or approximately 468.
Tonight’s Assignment • Unit 2: Worksheet A
Percentiles • Standardized scores are often reported as percentiles. • Percentiles indicate the percent of data that falls at or below a given observation. • For example, if an 8th grader scores in the 80th percentile on the CRCT, 80% of all students scored at or below his score.
Find the Percentile • If the top score on the Math SAT is 800, the mean score is 500, find value of the 80th percentile. • (In other words, 80% of the students scored at or below what score)? • To find this, we need to use the Standard Normal Table “backwards” and start with the proportion, then find the z score.
Find the Percentile • Look in the table to find .8000 (80%) • Since .8000 is not in the table, we must find the closest value, which is .7995 • Determine the corresponding Z-Score (in this case, 0.84. So, the 80% percentile is 0.84 standard deviations above the mean.
How do we find the percent of data that is greater than our observation? • Remember, the Standard Normal table tells us the proportion of data that is less than or equal to our observation (x). • To find the proportion to that is greater than x, you must subtract the proportion from 1 (or the percent from 100%).
The scores for all high school seniors taking the verbal section of the Scholastic Aptitude Test (SAT) in a particular year had a mean of 490 and a standard deviation of 100. The distribution of SAT scores is normal. One student scored 795 on this test. In the last problem we found the proportion of students that scored at or below 795 on the test. How can we find the number that scored above 795 on the test? First, we need to standardize the score of 795. In doing so, we see that this student scored 3.05 standard deviations above the mean of 490.
The Standard Normal Distribution This is part of a standard Normal table that you should be able to read. Since our particular problem deals with a z-score of 3.05, we should go to the last row (3.0) and over to the appropriate column (0.05). We should see that they meet at 0.9989. This is the proportion TO THE LEFT of our score (of 795). But we need the amount TO THE RIGHT of our score. Remember, the total area is 100%. So 100% - 99.89% of all students scored ABOVE 795 on the SAT. Only 0.11% scored better than 795 on the SAT.
Tonight’s Assignment • Unit 2: Worksheet B
How do we find the percent of data that is between two observed values? • Remember, the Standard Normal table tells us the proportion of data that is less than or equal to our observation (x). • To find the proportion to that is between x1 and x2: • Find the Z-Score for both numbers. • Find the corresponding proportion. • Subtract the x1 proportion from the x2 proportion.
We get 0.9767 and 0.8621 as the probability associated with these 2 z-scores.
Professor Halen has 184 students in his college mathematics lecture class. The scores on the midterm exam are normally distributedwith a mean of 72.3 and a standard deviation of 8.9. How many students in the class can be expected to receive a score between 82 and 90? Express answer to the nearest student. • So, we can subtract 0.9767-0.8621 to yield a proportion of 0.1146. • This means that 11.46% of all students scored between an 82 and 90. • Therefore, roughly 21 (21.0864) of the 184 students scored between an 82 and 90. We get 0.9767 and 0.8621 as the probability associated with these 2 z-scores.
Review • Percent • Percentile • Proportion • Standardized Distribution • Standard Normal Table • Z-Score
Aliens have come to visit Earth. We quickly establish that they are shorter than humans. In fact, their heights vary normally with a mean of 50 cm and standard deviation of 10 cm. • 1. Aliens place emphasis on height. For an alien to be a “leader” it would need to be at least 75 cm tall. What proportion of aliens would qualify? • 2. Short aliens are often sent to the front lines in battle because they are smaller targets. All aliens that are under 37 cm tall can expect to be called into duty. What percent of aliens fall into this category? • 3. What percent of all aliens are between 41 and 71 cm tall?
Aliens have come to visit Earth. We quickly establish that they are shorter than humans. In fact, their heights vary normally with a mean of 50 cm and standard deviation of 10 cm. • 1. Aliens place emphasis on height. For an alien to be a “leader” it would need to be at least 75 cm tall. What proportion of aliens would qualify? This yields a proportion of 0.9938 to the left (or 0.0062 to the right). So, only a proportion of 0.0062 of all aliens would qualify for a leadership positions.
Aliens have come to visit Earth. We quickly establish that they are shorter than humans. In fact, their heights vary normally with a mean of 50 cm and standard deviation of 10 cm. • 2. Short aliens are often sent to the front lines in battle because they are smaller targets. All aliens that are under 37 cm tall can expect to be called into duty. What percent of aliens fall into this category? This yields a proportion of 0.0968 to the left. Therefore, 9.68% of all aliens should be expected to serve their duty on the front lines of battle.
Aliens have come to visit Earth. We quickly establish that they are shorter than humans. In fact, their heights vary normally with a mean of 50 cm and standard deviation of 10 cm. • 3. What percent of all aliens are between 41 and 71 cm tall? This yields proportions to the left of 0.9821 and 0.1841. So, when we subtract these proportions, we find that the proportion of aliens between 41 and 71 cm tall is 0.7980. In other words, approximately 79.80% of all aliens are between 41 and 71 cm tall.