Download
1 / 15
150 likes | 282 Views
Standard Normal Distribution. AP Statistics Mr. Clark. Warm Up. AP Free Response 2000 #3. Homework. Any Questions? Pass it in. http://en.wikipedia.org/wiki/Normal_distribution. Notes:. Notation: A normal distribution with mean µ and standard deviation σ , can be written as N(µ, σ )

E N D
Standard Normal Distribution AP Statistics Mr. Clark
Warm Up • AP Free Response 2000 #3
Homework • Any Questions? • Pass it in. • http://en.wikipedia.org/wiki/Normal_distribution
Notes: • Notation: A normal distribution with mean µ and standard deviation σ, can be written as N(µ, σ) • The Standard Normal Distribution has mean = 0, and standard deviation = 1; i.e. N(0, 1).
Z-scores • A z-score measures the number of standard deviations an observation is from the mean. • Ex 1: ACT scores are normally distributed with µ = 18 and σ = 6. What is the z-score of an ACT score of 24? 6? 33?
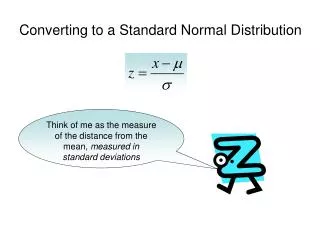
Formal definition of z-score • If x is an observation from a distribution with mean µ and standard deviation σ, the standardized value of x is: • A standardized value is often called a z-score
Normal vs Standard Normal • If a variable x is normally distributed, N(µ, σ), then the standardized variable z will have the standard normal distribution, N(0, 1). • Why Standard? See table A
Calculations Using Table A • ACT scores are N(18,6). • What proportion of scores are lower than 20? • What proportion of scores are between 30 and 36? • What proportion of scores are below 34? • What proportion of scores are above 26?
4 – Step Problem Process • State the problem in terms of the observed variable x. Draw Picture. • Standardize and redraw picture. • Calculate the area for the desire region. • State conclusion in context of original question.
Example • A study found that the body temperature of college students was normally distributed. Consider the following Minitab output of their results. Variable N Mean Median Tr Mean StDev SE Mean BODY TEMP 130 98.249 98.300 98.253 0.733 0.064 Variable Min Max Q1 Q3 BODY TEMP 96.300 100.800 97.800 98.700
Example cont. • If a fever is defined to be a temperature over 100.1 degrees. What proportion of college students have a fever? • Use 4-step method.
Working Backward • Back to ACT scores. What ACT score is at the 60th percentile? • Between what two scores are middle 80% of students?
HW • 2.19 – 2.20(p95) • 2.21 – 2.25(p103)