Download
1 / 20
200 likes | 312 Views
IPED COAL POWER CONFERENCE. Planning in a Carbon- Constrained World. presented by. January 18-19, 2007 St. Petersburg, FL. Evis C. Couppis, PhD, P.E. R. W. Beck, Inc. Agenda. Characterize CO 2 emissions Identify possible CO 2 capture/sequestration options

E N D
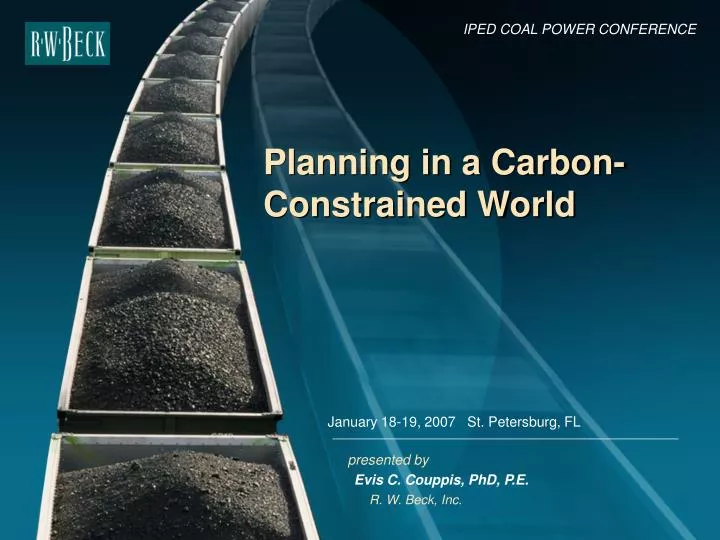
IPED COAL POWER CONFERENCE Planning in a Carbon- Constrained World presented by January 18-19, 2007 St. Petersburg, FL Evis C. Couppis, PhD, P.E. R. W. Beck, Inc.
Agenda • Characterize CO2 emissions • Identify possible CO2 capture/sequestration options • Review CO2 capture/sequestration costs • Review possible CO2 allowance pricing • Identify planning options going forward
Will We Get CO2 Legislation? • In 2004, 60% of utilities surveyed believed we will get legislation • In 2006, 93% of utilities surveyed believed we will get legislation • We already have legislation in California and other programs such as RGGI in Northeast • The real issue isn’t whether it will happen but when it will happen
2006 U.S. CO2 Emissions Sector MMetric Tons Power 2357 Transportation 1962 Industrial 1050 Residential 351 Commercial 221 5941 TOTAL EIA (2006)
U.S. CO2 Emissions by Sector Residential 6% Commercial 4% Industrial Power 18% 39% Transportation 33% EIA (2006)
U.S. CO2 Emissions by Fuel Type Other 0% Coal 37% Petroleum 43% Natural Gas 20% EIA (2006)
U.S. CO2 Emissions From Power Generation Other 1% Petroleum 3% Gas 14% Coal 82% EIA (2006)
U.S. Electricity Sector by Fuel Type, Qbtu Imports Renewables 0% 10% Nuclear 20% Coal 53% Petroleum 2% Gas 15% EIA (2006)
CO2 Emissions by Technology/Fuel Type PC 0.95 Gas Combined Cycle 0.41 IGCC 0.88 Emissions, Tons/Mwhr Technology/Fuel Type
Carbon Capture Options • Amine scrubbing • Amine-based solid sorbent • Selexol process • Rectisol process • Aqueous ammonia scrubbing • Aqueous ammonia multi-pollutant capture • PC oxy-fuel combustion, cryogenic ASU • PC oxy-fuel combustion, oxygen-selective membrane ASU • Co-sequestration of CO2/SO2/NOx
Carbon Sequestration Options • Injection into oil/gas reservoirs • Injection into deep, unmineable coal seams • Injection into saline aquifers • Injection into deep oceans • Indirect sequestration (trees)
Cost Impacts of CO2 Capture/Sequestration • What are impacts if new plants were equipped with CO2 capture/sequestration? • Under stringent regulations – approximately 90% removal • Under a cap and trade system, these capture/sequestration costs may not represent the most cost effective option • The costs presented are order of magnitude at best • The costs of CO2 control under a cap and trade would depend on all available options to generate credits/reductions/offsets • Costs would be dependent on the stringency of the regulations
Heat Rate Impacts 40 PC 35 PCSC 30 25 Percent Increase IGCC 20 15 NGCC 10 5 0 Technology Type NETL(2006), MPR Associates (June 2005), Bechtel (November 2002)
Capital Cost Impacts 90 PC 80 PCSC 70 60 50 Percent Increase NGCC 40 IGCC 30 20 10 0 Technology Type NETL(2006), MPR Associates (June 2005), Bechtel (November 2002)
Cost of Electricity Impacts 80 PC PCSC 70 60 50 Percent Increase 40 NGCC IGCC 30 20 10 0 Technology Type NETL(2006), MPR Associates (June 2005), Bechtel (November 2002)
CO2 Avoided Costs Cost of CO2 avoided= ($/Mwhr)capture – ($/Mwhr)reference ∕ (tCO2/Mwhr)reference – (tCO2/Mwhr)capture Note: Mwhr based on net power
Possible Allowance Pricing • In Europe, 5-30 Euros/ton with an average approximately 15 Euros (2005-2006) • Southern Company Report (May 2005) estimates, high of $7 in 2010-$20/ton in 2030 (2004$); medium of $6-$7/ton • National Energy Commission recommended $7/ton in 2010 escalating 5%/year • ICF (January 2006) estimates, high of $10 in 2010-$20/ton in 2025 (2003$); expected $5-$15/ton
Will CO2 Costs be Fully Recoverable? • Depends on your generation mix • Depends on regulated vs. unregulated market • Depends on whether gas or coal is on margin • Gas will likely be impacted more than coal
Utility Planning Steps • Quantify present emissions • Take advantage of easy efficiency improvements (pick low hanging fruit) • Consider CO2 regulations/legislation in planning (particularly in technology selection) • Conduct risk analysis (level of regulation, timing, etc.)
IPED COAL POWER CONFERENCE Questions Evis C. Couppis, PhD, P.E. R. W. Beck, Inc. ecouppis@rwbeck.com (303) 299-5230