Download
1 / 23
230 likes | 404 Views
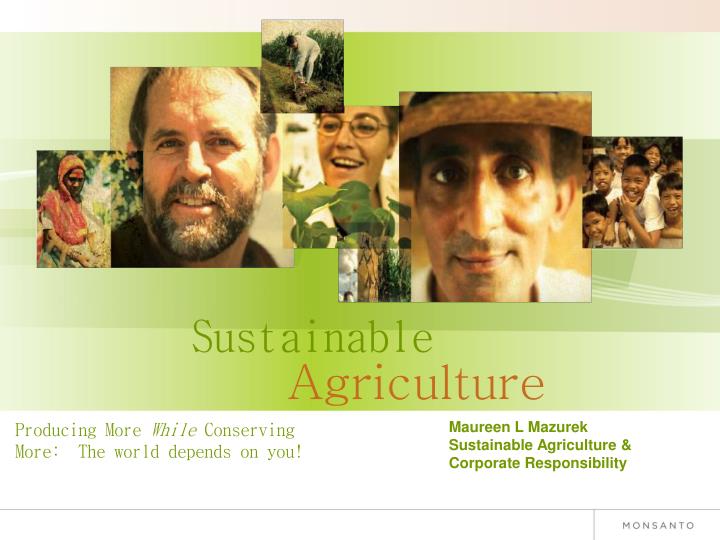
Sustainable. Agriculture. Producing More While Conserving More: The world depends on you!. Maureen L Mazurek Sustainable Agriculture & Corporate Responsibility. Monsanto’s Commitment to Sustainable Yield. Conserve More. Produce More. Improve Lives. The Challenge.

E N D
Sustainable Agriculture Producing More While Conserving More: The world depends on you! Maureen L MazurekSustainable Agriculture & Corporate Responsibility
Monsanto’s Commitment to Sustainable Yield Conserve More Produce More Improve Lives
The Challenge Source: J. Hatfield, US National Laboratory for Agriculture and the Environment.
Meeting anticipated demand for food is just one part of the challenge…
World Population Growth Source: International Database
Population still growing, albeit at a slower pace Global Population Source: IHS Global Insights, Agriculture Division
Personal income levels expanding rapidly, globally and among lower income segments of population Global Personal Income Source: IHS Global Insights, Agriculture Division
Dramatic dietary shifts occur between $800/yr and $10,000/yr per capita income Per Capita Income Growth in China 2030: 11,500/person 2004: 6,065/person 8 Source: World Bank reports.
Global economic growth rates returning to near pre-recession levels 9 Source: IHS Global Insight, Ag Insights March 2009
Growing global affluence driving dietary change and commodity demand accordingly 10 Source: IHS Global Insights, Agriculture Division
Corn demand is accelerating globally led by North America, China, South America and Africa Global Corn Demand 11 Source: IHS Global Insights, Agriculture Division
The US is in an excellent position to meet the growing demand for imported corn through 2030 and beyond 12 Source: IHS Global Insights, Agriculture Division
Breeding, Agronomic Practice Improvements and BiotechnologyCan Maximize Yield Gains Corn Yield Potential to 2030 in the United States 13 Sources: U.S. Department of Agriculture, Monsanto Company estimates
The Need to Produce More and Conserve More • By 2025, water scarcity could affect annual global cropproduction equal to losing the entire grain crops of India and the U.S. combined • Agricultural productivity still highly sensitive to energy prices: • Nitrogen fertilizer • Diesel fuel • Electricity for drying/pumping 14
Resource productivity gaps loom as a multi-faceted challenge – water perhaps the greatest Historical resource productivity growth rate 1990-2008 (%) Required resource productivity growth rate 2008-2030 (%) 15 Source: Water: 2030 Water Resources Group – Global Water Supply and Demand model; IFPRI; FAOSTAT; GDP: Global Insight; GHGs: IPCC; Oil: IEA WEO 2008 reference scenario; Power: IEA WEO 2008 (historic) and McKinsey Global Abatement Cost Curve v2.0(2030); Food/feed: FAO 2008
Future Demand for Water Will Outstrip Our Capacity to Provide It Without Productivity Gains 2.0% Billion m3, 154 basins/regions 6,906 -40% 2,765 4,222 4,208 81 Domestic Groundwater Industry Surface water Agriculture 2005 demand1 2030demand2 Basins with deficits Basins with surplus Planned supply 20303 1. Demand in 2005 based on inputs from IFPRI 2. Demand in 2030 based on frozen technology and no increase in water efficiency after 2010 3. Supply at 90% reliability and including infrastructure investments scheduled and funded through 2010; supply in 2005 is 4,081 BCM per year; supply in 2030 under projected technological and infrastructural improvements equals 4,866 BCM per year; net of environmental requirements 16 Source: Water 2030 Global Water Supply and Demand model; agricultural production based on IFPRI IMPACT-WATER base case
Projected Gaps Strongly Differ by Country and Basin Surplus 0 - 25% 25 - 50% 50 - 75% 75 - 100% Japan Tanzania Bangladesh Ethiopia 50% South Africa Nigeria 25% Indonesia Sudan 0 China -25% India -50% Russia Mexico -75% Pakistan Brazil Basins in China Basins in India 25% 0.25 0 0 -25% -0.25 -50% -75% -0.50 WFR2 Hai Yangtze Pearl Brahmaputra Ganga WFR1 SW SE NW Godavari Krishna Song Indus Huang Huai Liao Water gap as percent of total implied demand 2030 projections1 17 1. 2030 projections, assuming technological innovation and infrastructure improvement investments are frozen at 2010 levels SOURCE: 2030 Water Resources Global Supply and Demand model; based on IFPRI data
External partnerships at the heart of our strategy "As an agricultural company focused on increasing crop yields, we will do our part," he said. "But it will also require the efforts of a diverse group of organizations with many points of view to work together and take action to address the daunting challenges facing us all.“ - Mr. Hugh Grant, CEO Comments from Monsanto press release announcing Sustainable Yield Commitments (June 4, 2008) 19
Conservation gains in US corn production based on resource use intensity (2000-20081) 20% aggregate reduction thru 2008 Goal: 33% aggregate reduction 1 Source: Field to Market Alliance; indexed to actual values in year 2000
Monsanto supports development of industry-wide platforms to communicate about sustainable agriculture The Global Agriculture Productivity GAP • “We have 40 years to double agricultural output, but we have to do it in a sustainable fashion with the same amount of land, less water and reduced inputs.” • Bill Lesher • Executive Director • Global Harvest Initiative 21 Source: Farm Foundation, NFP calculations (2010) based on USDA- ERS Data, GHI GAP Report
Modern technology requires modern policy for gains to be realized by farmers and consumers 22