Download
1 / 1
10 likes | 252 Views
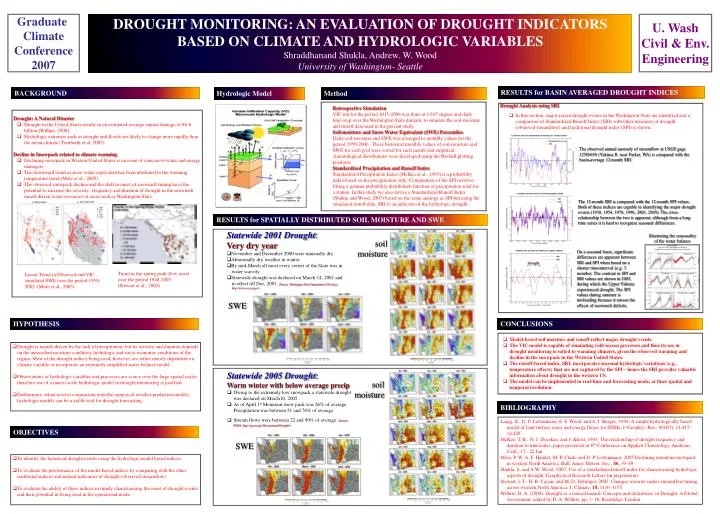
Graduate Climate Conference 2007. DROUGHT MONITORING: AN EVALUATION OF DROUGHT INDICATORS BASED ON CLIMATE AND HYDROLOGIC VARIABLES Shraddhanand Shukla, Andrew. W. Wood University of Washington- Seattle. U. Wash Civil & Env. Engineering. RESULTS for BASIN AVERAGED DROUGHT INDICES.

E N D
Graduate Climate Conference 2007 DROUGHT MONITORING: AN EVALUATION OF DROUGHT INDICATORS BASED ON CLIMATE AND HYDROLOGIC VARIABLES Shraddhanand Shukla, Andrew. W. Wood University of Washington- Seattle U. Wash Civil & Env. Engineering RESULTS for BASIN AVERAGED DROUGHT INDICES BACKGROUND Hydrologic Model Method Drought Analysis using SRI • Retrospective Simulation • VIC run for the period 1915-2006 was done at 1/16th degree and daily time-step over the Washington State domain, to simulate the soil-moisture and runoff data used in the present study. • Soil-moisture and Snow Water Equivalent (SWE) Percentiles • Daily soil-moisture and SWE was averaged to monthly values for the period 1950-2006. These historical monthly values of soil-moisture and SWE for each grid were sorted for each month and empirical climatological distributions were developed using the Weibull plotting positions • Standardized Precipitation and Runoff Index • Standardized Precipitation Index (McKee et al., 1993) is a probability index based on the precipitation only. Computation of the SPI involves fitting a gamma probability distribution function of precipitation total for a station. In this study we also devise a Standardized Runoff Index (Shukla and Wood, 2007) based on the same analogy as SPI but using the simulated runoff data. SRI is an indicator of the hydrologic drought. • Drought: A Natural Disaster • Drought in the United-States results in an estimated average annual damage of $6-8 billion [Wilhite, 2000] • Hydrologic extremes such as drought and floods are likely to change more rapidly than the mean climate (Trenberth et al. 2003) Decline in Snowpack related to climate warming • Declining snowpack in Western United States is an issue of concern to water and energy managers. • The downward trend in snow water equivalent has been attributed to the warming temperature trend (Mote et al., 2005). • The observed snowpack decline and the shift in onset of snowmelt timing have the potential to increase the severity, frequency and duration of drought in the snowmelt runoff driven water resources of areas such as Washington State. • In this section, major recent drought events in the Washington State are identified and a comparison of Standardized Runoff Index (SRI) with other measures of drought (observed streamflow) and traditional drought index (SPI) is shown. The observed annual anomaly of streamflow at USGS gage 12500450 (Yakima R. near Parker, WA) is compared with the basin-average 12-month SRI. The 12-month SRI is compared with the 12-month SPI values. Both of these indices are capable in identifying the major drought events (1930, 1954, 1976, 1996, 2001, 2005). The close relationship between the two is apparent, although from a long time series it is hard to recognize seasonal differences. RESULTS for SPATIALLY DISTRIBUTED SOIL MOISTURE AND SWE • Statewide 2001 Drought: • Very dry year • November and December 2000 were unusually dry • Abnormally dry weather in winter. • By mid-March all most every corner of the State was in water scarcity. • Statewide drought was declared on March 14, 2001 and in effect till Dec, 2001. (Source: Washington State Department of Ecology http://www.ecy.wa.gov) illustrating the seasonality of the water balance soil moisture On a seasonal basis, significant differences are apparent between SRI and SPI when based on a shorter time-interval (e.g. 3 months). The contrast in SPI and SRI values are shown in 2005, during which the Upper Yakima experienced drought. The SPI values during summer is misleading because it misses the effects of snowmelt deficits. drought • Trend in the spring peak-flow onset over the period 1948-2005 • (Stewart et al., 2005) • Linear Trend in Observed and VIC simulated SWE over the period 1950-2002. (Mote et al., 2005) SWE HYPOTHESIS CONCLUSIONS • Model-based soil moisture and runoff reflect major drought events. • The VIC model is capable of simulating cold season processes and thus its use in drought monitoring is suited to warming climates, given the observed warming and decline in the snowpack in the Western United States. • The runoff-based index, SRI, incorporates seasonal hydrologic variations (e.g., temperature effects) that are not captured by the SPI – hence the SRI provides valuable information about drought in the western US. • The model can be implemented in real-time and forecasting mode, at finer spatial and temporal resolution. • Drought is mainly driven by the lack of precipitation, but its severity and duration depends on the antecedent moisture condition, hydrologic and socio-economic conditions of the region. Most of the drought indices being used, however, are either merely dependent on climate variable or incorporate an extremely simplified water balance model. • Observations of hydrologic variables and processes are scarce over the large spatial scales therefore use of a macro-scale hydrologic model in drought monitoring is justified. • Furthermore, when used in conjunction with the numerical weather prediction models, hydrologic models can be a viable tool for drought forecasting. • Statewide 2005 Drought: • Warm winter with below average precip • Owing to the extremely low snowpack a statewide drought was declared on March10, 2005. • As of April 1st Mountain snow pack was 26% of average Precipitation was between 51 and 76% of average • Stream flows were between 22 and 90% of average(Source: WSDA, http://agr.wa.gov/Environment/Drought/) soil moisture BIBLIOGRAPHY Liang, X., D. P. Lettenmaier, E. F. Wood, and S. J. Burges, 1994: A simple hydrologically based model of land surface water and energy fluxes for GSMs, J. Geophys. Res., 99(D7), 14,415–14,428. McKee, T. B., N. J. Doesken, and J. Kleist, 1993: The relationship of drought frequency and duration to timescales, paper presented at 8th Conference on Applied Climatology, Anaheim, Calif., 17– 22 Jan. Mote, P. W, A. F. Hamlet, M. P. Clark, and D. P. Lettenmaier, 2005:Declining mountain snowpack in western North America. Bull. Amer. Meteor. Soc., 86, 39–49. Shukla, S. and A.W. Wood, 2007: Use of a standardized runoff index for characterizing hydrologic aspects of drought, Geophysical Research Letters (in preparation) Stewart, I. T., D. R. Cayan, and M. D. Dettinger, 2005: Changes towards earlier streamflow timing across western North America. J. Climate, 18, 1136–1155. Wilhite, D. A. (2000). Drought as a natural hazard: Concepts and definitions, in Drought: A Global Assessment, edited by D. A. Wilhite, pp. 3–18, Routledge, London OBJECTIVES SWE • To identify the historical drought events using the hydrologic model based indices. • To evaluate the performance of the model based indices by comparing with the other traditional indices and natural indicators of drought (observed streamflow) • To evaluate the ability of these indices in timely characterizing the onset of drought events and their potential in being used in the operational mode.