Download
1 / 68
690 likes | 837 Views
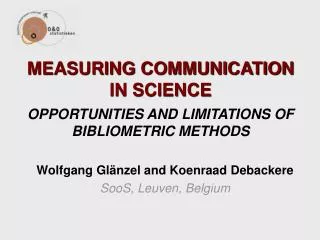
Measuring UNL Research the use and interpretation of bibliometric indicators. Martijn S. Visser Lisbon, 29 June 2012. Contents. Role of citation analysis in research evaluation Coverage of bibliometric databases Bibliometric indicators Challenges and Future Work.

E N D
Measuring UNL Research the use and interpretation of bibliometric indicators Martijn S. Visser Lisbon, 29 June 2012
Contents • Role of citation analysis in research evaluation • Coverage of bibliometric databases • Bibliometric indicators • Challenges and Future Work
1. Role of citation analysis in research evaluation • What do citations measure? • Citation analysis and peer review
Citation motivations (Garfield, 1962) • Paying homage to pioneers • Giving credit for related work (homage to peers) • Identifying methodology, equipment, etc. • Providing background reading • Correcting one’s own work • Correcting the work of others • Criticizing previous work • Substantiating claims • Alerting to forthcoming work • Providing leads to poorly disseminated, poorly indexed, or uncited work • Authenticating data and classes of fact (physical constants, etc.) • Identifying original publications in which an idea or concept was discussed • Identifying original publication or other work describing an eponymic concept or term (...) • Disclaiming work or ideas of others (negative claims) • Disputing priority claims of others (negative homage)
Citations as a proxy of scientific impact Visibility Relevance Quality Scientific impact Citations Reputation Random factors
Citation analysis and peer review Performance of a research unit Scientific performance Societal performance Managerial performance Productivity Quality Relevance Scientific impact Citations Visibility Reputation? Training Citation analysis
Citation analysis and peer review Performance of a research unit Scientific performance Societal performance Managerial performance Productivity Quality Relevance Scientific impact Citations Visibility Reputation? Peer review Training Citation analysis
2. Coverage of the Citation Index • Measuring Coverage • UNL coverage
‘Important’ literature Citation Index All literature
Measuring Citation Index coverage: 2 approaches • External: Compare the Citation Index with an external source of publications (publication lists, other databases and repositories) • Internal: Measuring the extent to which the documents cited in Citation Index are themselves covered by the Citation Index
Not in WoS WoS Coverage = 5/7 = 71%
3. Bibliometric Indicators • Size dependence vs size independent indicators • Normalized indicators • Dimensions of scientific performance
Unnormalized indicators • Indicators: • P: Number of publications • TCS: Total citation score • MCS: Mean citation score • Calculation: • Only documents classified as ‘article’, ‘review’, or ‘letter’ • Self citations are ignored
Size dependence vs size independence (2) • Size-dependent and size-independent indicators address different questions • Size-independent indicators (MCS): • How does UNLperform compared with other Portuguese univs? • How ‘prestigious’ is UNL? • Size-dependent indicators (P, TCS): • Is the subscription fee of this journal reasonable? • How influential has this research group been during a given period?
Normalized indicators • Indicators: • MNCS: Mean normalized citation score • MNJS: Mean normalized journal score • A/E Ptop 10%: Actual to expected ratio of publications in top 10% • Calculation: • Documents classified as ‘letter’ have a weight of 0.25 • Citation window length must be at least 12 months
Expected number of citations • The expected number of citations of a publication is defined as the average number of citations of all publications • published in the same field, • published in the same year, and • having the same document type
Dimensions of scientific profile • Output • Impact • Journal impact • Collaboration • Scientific profile • Knowledge user profile
4. Challenges and work in progress • Definition of fields • Increasing coverage of bibliometric database • Stability intervals • Increasing number of authors / collaboration
Comparison with old normalization approach (1) MNCS = (1 / 2.32 + 8 / 2.32 + 9 / 14.17) / 3 = 1.50 CPP/FCSm = (1 + 8 + 9) / (2.32 + 2.32 + 14.17) = 0.96 MNJS = (1.89 / 2.32 + 3.11 / 2.32 + 10.54 / 14.17) / 3 = 0.97 JCSm/FCSm = (1.89 + 3.11 + 10.54) / (2.32 + 2.32 + 14.17) = 0.83
Dependence on database coverage Effect of excluding non-English journals from WoS
Full counting vs fractional counting • Full counting means that all publications have the same weight • Fractional counting means that the weight of a publication is inversely proportional to the number of collaborators
Example • Full-counting MCS: (1 + 8 + 9) / 3 = 6 • Fractional counting MCS: (1 + 8 + 1/4 9) / (1 + 1 + 1/4) = 5 Single-authored Co-authored with 3 other groups
Advantages and disadvantages • Full counting: • Simple approach • Does not discourage collaboration • May encourage ‘artificial collaborations’ • Average MNCS over all research groups in the world need not equal 1 • Fractional counting: • More complex approach • May discourage collaboration • Does not encourage ‘artificial collaborations’ • Average MNCS over all research groups in the world equals 1
Full counting ‘bonus’ • Publications with more collaborators tend to have a higher impact • In the case of full counting, these publications are ‘double counted’ • As a consequence: • Average MNCS over all research groups in the world is higher than 1 • Average PPtop 10% over all research groups in the world is higher than 10%
Comparison with old normalization approach (2) CPP/FCSm vs MNCS for 158 Dutch chemistry research groups
Comparison with old normalization approach (3) CPP/FCSm vs MNCS for the 365 largest universities worldwide
Productivity is not rewarded • Two equally-sized research groups • Group 1: • 100 publications with 20 citations each • Mean citation score: (100 20) / 100 = 20 • Group 2: • 100 publications with 20 citations each and 50 publications with 10 citations each • Mean citation score: (100 20 + 50 10) / (100 + 50) = 16.67 • Group 2 has a lower mean citation score, even though this group seems to have performed better
Limitations of citation analysis Important being aware of them 2 main categories of limitations: Conceptual: limitations that are related to the concept of citations. Practical: more data and technical issues in the calculation and use of bibliometric indicators.
Limitations of citation analysis Meaning of citations Meaning of authorship Limited scope of citation analysis Retrospective nature of bibliometrics Limited reliability Behavioral effects of citation analysis Data limitations Technical limitations
1) Meaning of citations Citations are assumed to measure scientific influence Other factors influence the meaning citations Do all citations measure the same concept? Let’s discuss an example…
Limitations of citation analysis Meaning of citations Meaning of authorship Limited scope of citation analysis Retrospective nature of bibliometrics Limited reliability Behavioral effects of citation analysis Data limitations Technical limitations
2) Meaning of authorship Most publications have multiple authors How much each author should be credited for the citations of their publications? Let’s see an example:
Have all these authors contributed the same? Citation 1. “The h-index, introduced only 2 years ago, has become a real hype in and even outside informetrics: Ball (2005, 2007), Bornmann and Daniel (2005, 2007a), [….] Rao and Rousseau (2007), Vinkler (2007), Vanclay (2007) and see also the papers in the special issue on the Hirsch index in Journal of Informetrics 1(3), 2007: Schubert and Glänzel (2007), Beirlant, Glänzel, Carbonez and Leemans (2007), Costas and Bordons (2007) and Bornmann and Daniel (2007b).” Citation 2. “Costas and Bordons (2007) analyze the relationship of the h-index with other bibliometric indicators... The authors suggest that the h-index tends to underestimate the achievement of scientists with a "selective publication strategy", that is, those who do not publish a high number of documents but who achieve a very important international impact. In addition, a good correlation is found between the h-index and [...] absolute indicators of quantity. Finally, they notice that the widespread use of the h-index in the assessment of scientists' careers might […] foster productivity instead of promoting quality […] since the maximum h-index an author can obtain is that of his/her total number of publications”
New trends in author contributions: PLoS ONE: But also elsewhere
Limitations of citation analysis Meaning of citations Meaning of authorship Limited scope of citation analysis Retrospective nature of bibliometrics Limited reliability Behavioral effects of citation analysis Data limitations Technical limitations
3) Limited scope of citation analysis Citation analysis cannot measure the scientific impact of everything (computer software, lectures, teaching, blogs, societal impact, etc.) Only specific types of scientific outputs (journal articles, books, conference proceedings) Restricted to a limited set of scientific outputs
What would you do? “The Board of our university is interested in analyzing the scientific impact of all the electronic material (blogs, websites, etc.) produced by our staff. Could you help us with a bibliometric analysis?” “In our university we are interested in assessing the impact of ALL scientific outputs of our researchers. This includes: articles, books, conference proceedings, patents, lectures, etc. Is this feasible?”
Limitations of citation analysis Meaning of citations Meaning of authorship Limited scope of citation analysis Retrospective nature of bibliometrics Limited reliability Behavioral effects of citation analysis Data limitations Technical limitations
4) Retrospective nature of bibliometrics Backwards looking Sometimes only short term impact (e.g. recent publications) Using recent publications can be problematic Let’s discuss an example.
What would you say? Institute created in October 2011 Very young researchers appointed (age ~30) Since then ~50 pubs. have been produced Is a citation analysis useful?
Limitations of citation analysis Meaning of citations Meaning of authorship Limited scope of citation analysis Retrospective nature of bibliometrics Limited reliability Behavioral effects of citation analysis Data limitations Technical limitations
5) Limited reliability Dependence on the volume of citations and publications Small numbers of publications introduce noise (individual level) Some disciplines have a low ‘citation density’ (e.g. mathematics, engineering, and most socials sciences) This limitation can not be solved Let’s discuss an example.
Example of the problem of reliability 2 departments of mathematics (Dept1 & Dept2) Reward one with a grant (“the most productive and cited department”) All scientific outputs and impact thoroughly collected (“nothing is missing”) Results: Dept1: 10 outputs, 15 citations Dept2: 9 outputs, 14 citations Is it correct to give the grant to Dept 1?