Download
1 / 11
160 likes | 542 Views
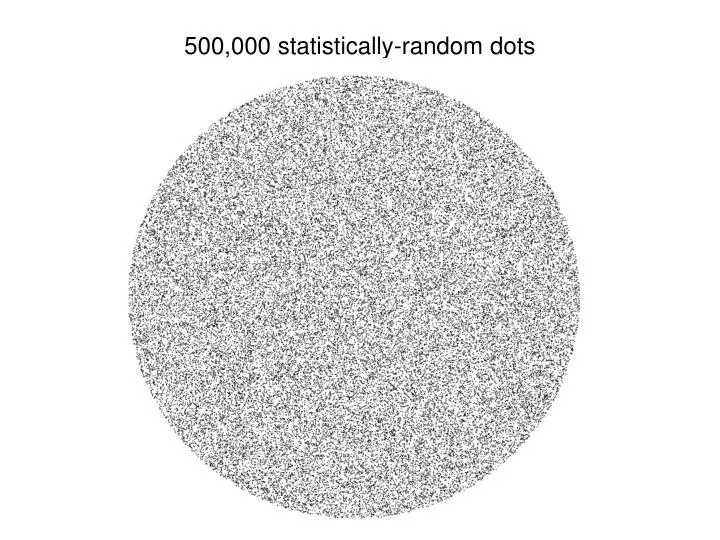
500,000 statistically-random dots. Brightest ~500,000 Galaxies in the Northern Hemisphere (1977; RA & DEC only). 2-D “ lacework ” pattern. CfA “ Slice of the Universe ” (1987; first 3-D view of the galaxy distribution). Two Degree Field Galaxy Redshift Survey (2dFGRS); ~250,000 galaxies.

E N D
Brightest ~500,000 Galaxies in the Northern Hemisphere (1977; RA & DEC only) 2-D “lacework” pattern
CfA “Slice of the Universe”(1987; first 3-D view of the galaxy distribution)
Two Degree Field Galaxy Redshift Survey (2dFGRS); ~250,000 galaxies
The Local Network of “Superclusters” and Voids(organization of the universe on the largest scale) Galaxies cluster together to form “groups” or “clusters” of galaxies Clusters of galaxies cluster together to form “superclusters” of galaxies Superclusters are still in the process of forming (not virialized) We belong to the Virgo Supercluster Voids are regions of space where, for some reason, galaxies had a hard time forming Each white dot in the picture represents a galaxy.
Cold, Warm & Hot Dark Matter Universes CDM Dark matter only simulations by Ben Moore (University of Zurich) WDM HDM
Galaxy Power Spectrum from SDSS (data points) compared to Lambda-CDM prediction (red line) P(k) from SDSS From Tegmark et al. (2004)