Download
1 / 87
1.09k likes | 1.82k Views
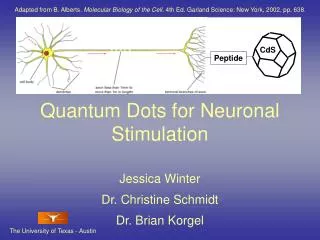
Quantum Dots. What is a quantum dot?. In two words, a semiconductor nanocrystal. Easily tunable by changing the size and composition of the nanocrystal. Gallium Arsenide Quantum Dots. Gallium arsenide is a III-V semiconductor

E N D
What is a quantum dot? • In two words, a semiconductor nanocrystal. • Easily tunable by changing the size and composition of the nanocrystal
Gallium Arsenide Quantum Dots • Gallium arsenide is a III-V semiconductor • Higher saturated electron velocity and higher electron mobility than silicon • Gallium arsenide can emit and absorb light, unlike silicon • No silicon laser is possible (or has been made yet)
Energy Band Levels • Electrons exist in discrete energy levels in bulk semiconductor material. • There exists a forbidden range of energy levels in any material called the band gap.
By absorbing some sort of stimulus (in light or heat form), an electron can rise to the conduction band from the valence band. • This action leaves behind a “hole” in the valence band. The hole and the electron together are called an exciton.
The average distance between an electron and a hole in a exciton is called the Excited Bohr Radius. • When the size of the semiconductor falls below the Bohr Radius, the semiconductor is called a quantum dot.
Tuning Quantum Dots • By changing size, shape, and composition, quantum dots can change their absorptive and emissive properties dramatically
Manufacturing methods • Electron beam lithography • Molecular beam epitaxy
Electron Beam Lithography • Electrons are accelerated out of an electron gun and sent through condenser lens optics directly onto a wafer • λ = (12.3 Å / √V) • Advantages: • generation of micron and submicron resist geometries • greater depth of focus than optical lithography • masks are unnecessary • Optical diffraction limit is not a real concern
Electron Beam Lithography • Disadvantage(s): • The lithography is serial (masks aren’t used; instead the beam itself sweeps across the wafer) => Comparatively low throughput ~5 wafers per hour at less than 1 micrometer resolution • The proximity effect: Electrons scatter because they are relatively low in mass, reducing the resolution. • Heavy ion lithography has been proposed, but still is in development stages
Molecular Beam Epitaxy • Molecular beam epitaxy (MBE) is the deposition of one or more pure materials onto a single crystal wafer one layer of atoms at a time in order to form a perfect crystal • This is done by evaporating each of the elements to combine, then condensing them on top of the wafer. • The word “beam” means that the evaporated atoms only meet each other on the wafer
Artificial Atom • Double Barrier Heterostructure • Dot: In0.05Ga0.95As • Source &Drain : GaAs • 2D Electron Gas • Confine with gate bias • D ~ Fermi wavelength → Discrete energy levels
Adding Electrons, changing Vgate • 2D-Harmonic Oscillator • Shell structure as in atoms • Magic Numbers: 2, 6, 12... • To add “even” electron requires only additional Coulomb energy
Hydrogen:Energy levels ~ 1eVSize ~ 1Å Only strong magnetic fields can perturb energy levelsFactor 1000... Comparison with Hydrogen • Artificial Atom:Energy levels ~ 1meVSize ~ 10μmWeak magnetic fields can affect energy levels
Tuning the Quantum Dot • Tune so we have one valence electron • Initial state can be set by applying homogeneous magnetic field → |0> • Low temperature: kT < ΔE (state gap) • Now we have defined our single qubit Energy Unoccupied state Gate bias Spin up - electron position
The Physical System: Excitons Trapped in GaAs Quantum Dots • Exciton - a Coulomb correlated electron-hole pair in a semiconductor, a quasiparticle of a solid. • Often formed when photons excite electrons from the valence band into the conduction band. • Wavefunctions are “hydrogen-like” i.e. an “exotic atom” though the binding energy is much smaller and the extent much larger than hydrogen because of screening effects and the smaller effective masses • Decay by radiating photons. Decay time ~50ps-1ns • Hence can define the computational basis as absence of an exciton |0>, or existence of an exciton |1>
Stufler et al. Large wafer containing InGaAs QD was placed between a bias voltage and exposed to ultrafast laser pulses. Cos(Θ/2)|0>+Sin(Θ/2)|1> |1> => electric charge =>Photocurrent (PC) PC~Sin2(Θ/2) π-pulse corresponds to a population inversion
Saint-Petersburg State University Quantum Dots. Optical and Photoelectrical properties of QD of III-V Compounds. Alexander Senichev Physics Faculty Department of Solid State Physics senichev_spb@mail.ru 8-921-5769793
Introduction • If the size of semiconductor crystal is reduced to tens or hundreds of inter-atomic spacing, all major properties of material change because of size quantization effects.
Introduction Quantum Well Quantum Dots • The extreme case of size quantization is realized in semiconductor structures with confinement of carriers in three directions – they are Quantum Dots.
а) E b ) E с) E d ) E Introduction • Generally, electronic spectrum of the ideal quantum dots is a set of discrete levels. Qualitative behavior of Density of States in: a) Bulk semiconductor b) Quantum Wells c) Quantum Wires d) Quantum Dots
Device application of QDs • Lasers with active area based on QDs • Light-Emitting Device (LED) based on QDs • Quantum Dots Solar Cells
Technology of QDs Formation • The base of technologies of QDs formation is self-organizing phenomenon. • There are three types of initial stage of epitaxial growth: • 2D growth of material A on surface of substrate B ; (Frank-van der Merve) • 3D growth of material A on surface of substrate B ( Volmer-Weber method); • Intermediate mode of growth – the Stranski-Krastanow mode. 2D growth 3D growth Stranski-Krastanow
Technology of QDs Formation • Molecular Beam Epitaxy (MBE) • MBE may be defined as the deposition of epitaxial films onto single crystal substrates using atomic or molecular beams. • MBE involves elementary processes: • Adsorption of atoms and molecules; • Thermal desorption; • 3) Diffusion of adatoms on surface • of substrate; • 4) Nucleation; 1 2 4 3 Solid substrate
Technology of QDs Formation • Molecular Beam Epitaxy (MBE) • MBE system consist of: • a growth chamber • a vacuum pump • a effusion (Knudsen) cells • a manipulator and substrate heater • an in-situ characterization tool – RHEED (reflection high energy electron diffraction) The typical rate of MBE growth is about 1 ML/s.
Technology of QDs Formation • Molecular Beam Epitaxy (MBE) • The oscillation of the RHEED signal exactly corresponds to the time needed to grown a monolayer. The diffraction pattern on the RHEED windows gives direct indication of the state of the surface.
Technology of QDs Formation • Metal organic chemical vapor deposition (MOCVD) • Metal organic chemical vapor deposition is a technique used to deposit layers of materials by vapor deposition process. • MOCVD system contains: • the gas handling system to meter and mix reagents • the reactor • the pressure control system • the exhaust facilities
Technology of QDs Formation • Metal organic chemical vapor deposition (MOCVD) • The basic chemistry equation of this reaction is as follows: • Group III sources are trimetilgallium (TMGa), TMAl, TMIn. • Group V sources are typically hydride gases such as arsine, phosphine. • Growth rate and composition is controlled by partial pressures of the species and by substrate temperature
Dependence of QDs morphology on growth conditions • The basic control parameters in the case of MBE growth: • the substrate temperature; • the growth rate; • the quantity InAs, ratios of III/V materials; • Exposure time in As stream; • As research shows, morphology of QDs ensembles strongly depends on temperature of substrate and growth rate.
Optical properties of QDs • Photoluminescence spectra of various ensembles of QDs:
Optical properties of QDs • The major processes which explain the temperature behavior of QDs PL-spectra: • Thermal quenching of photoluminescence Thermal quenching is explained by thermal escape of carriers from QD into the barrier (or wetting layer) • “Red shifting” As experiment shows, at the temperature, when thermal quenching begins, we can see a following change: the maximum of PL line is shifting in the “red region”.Such behavior of PL spectrum is explained by thermal quenching of carriers and their redistribution between small and large QDs.
Optical properties of QDs • Thermal broadening of PL-spectrum. The one of the major factors which defines PL-line width is size dispersion of QDs, i.e. statistic disregistry in ensembles of QDs.Other process which affects on PL-line width is the electron-phonon interaction. • Tunnel processes Tunneling of carriers between QDs competes with escape of carriers from QDs in all temperature range. Probability of tunneling increases with temperature growth. Tunneling processes can affect on high-temperature component of photoluminescence spectrum.
Photoelectrical properties of QDs Photoluminescence spectra at 10 K as a function of bias excited at (a) 1.959 eV above the GaAs band gap, (b) 1.445 eV resonant with the wetting layer, and (c) 1.303 eV resonant with the second dot excited state. Schematic excitation, carrier loss, and recombination processes are indicated for the three cases. Photocurrent spectra as a function of bias at 10 K. Quantum-dot features are observed for biases between -3 and -6 V. The inset shows photocurrent from two-dimensional wetting-layer transition, observed to its full intensity at biases of only ~ -0.5 V.
Semiconductor Quantum Dots Justin Galloway 2-26-07 Department of Materials Science & Engineering
Outline • Introduction • Effective Mass Model • Reaction Techniques • Applications • Conclusion
How • Quantum Dots • Semiconductor nanoparticles that exhibit quantum confinement (typically less than 10 nm in diameter) • Nanoparticle: a microscopic particle of an inorganic material (e.g. CdSe) or organic material (e.g. polymer, virus) with a diameter less than 100 nm More generally, a particle with diameter less than 1000 nm 1.Gaponenko. Optical properties of semiconductor nanocrystals 2.www.dictionary.com
Properties of Quantum Dots Compared to Organic Fluorphores? • High quantum yield; often 20 times brighter • Narrower and more symmetric emission spectra • 100-1000 times more stable to photobleaching • High resistance to photo-/chemical degradation • Tunable wave length range 400-4000 nm Properties CdSe CdTe http://www.sussex.ac.uk/Users/kaf18/QDSpectra.jpg J. Am. Chem. Soc. 2001, 123, 183-184
Excitation in a Semiconductor • The excitation of an electron from the valance band to the conduction band creates an electron hole pair Excitation Creation of an electron hole pair where h is the photon energy Band Gap (energy barrier) exciton: bound electron and hole pair usually associated with an electron trapped in a localized state in the band gap
Recombination of Electron Hole Pairs • Recombination can happen two ways: radiative and non-radiative Release recombination processes radiative recombination photon non-radiative recombination phonon (lattice vibrations)
Effective Mass Model • Developed in 1985 By Louis Brus • Relates the band gap to particle size of a spherical quantum dot Model Band gap of spherical particles The average particle size in suspension can be obtained from the absorption onset using the effective mass model where the band gap E* (in eV) can be approximated by: Egbulk - bulk band gap (eV), h - Plank’s constant (h=6.626x10⁻³⁴ J·s) r - particle radius e - charge on the electron (1.602x10⁻¹⁹ C) me - electron effective mass - relative permittivity mh - hole effective mass 0 - permittivity of free space (8.854 x10⁻¹⁴ F cm-1) m0 - free electron mass (9.110x10⁻³¹ kg) Brus, L. E. J. Phys. Chem. 1986, 90, 2555
Term 2 • The second term on the rhs is consistent with the particle in a box quantum confinement model • Adds the quantum localization energy of effective mass me • High Electron confinement due to small size alters the effective mass of an electron compared to a bulk material Model Consider a particle of mass m confined in a potential well of length L. n = 1, 2, … For a 3D box: n2 = nx2 + ny2 + nz2 Brus, L. E. J. Phys. Chem. 1986, 90, 2555
Term 3 • The Coulombic attraction between electrons and holes lowers the energy • Accounts for the interaction of a positive hole me+ and a negative electron me- Work, w = F·dr Model Electrostatic force (N) between two charges (Coulomb’s Law): Consider an electron (q=e-) and a hole (q=e+) The decrease in energy on bringing a positive charge to distance r from a negative charge is: Brus, L. E. J. Phys. Chem. 1986, 90, 2555
Term Influences • The last term is negligibly small • Term one, as expected, dominates as the radius is decreased Model Modulus Conclusion: Control over the particle’s fluorescence is possible by adjusting the radius of the particle
Quantum Confinement of ZnO & TiO2 • ZnO has small effective masses quantum effects can be observed for relatively large particle sizes • Confinement effects are observed for particle sizes <~8 nm • TiO2 has large effective masses quantum effects are nearly unobservable Model
Formation of Nanoparticles • Varying methods for the synthesis of nanoparticles • Synthesis technique is a function of the material, desired size, quantity and quality of dispersion The Making • Synthesis Techniques • • Vapor phase (molecular beams, flame synthesis etc… • • Solution phase synthesis • Aqueous Solution • Nonaqueous Solution Semiconductor Nanoparticles II-VI: CdS, CdSe, PbS, ZnS III-V: InP, InAs MO: TiO2, ZnO, Fe2O3, PbO, Y2O3 Semiconductor Nanoparticles Synthesis: Typically occurs by the rapid reduction of organmetallic precusors in hot organics with surfactants some examples of in vitro imaging with QDs (http://www.evidenttech.com/)
Nucleation and Growth The Making Figure 1. (A) Cartoon depicting the stages of nucleation and growth for the preparation of monodisperse NCs in the framework of the La Mer model. As NCs grow with time, a size series of NCs may be isolated by periodically removing aliquots from the reaction vessel. (B) Representation of the simple synthetic apparatus employed in the preparation of monodisperse NC samples. Horizontal dashed lines represent the critical concentration for nucleation and the saturation concentration C. B. Murray, C. R. Kagan, and M. G. Bawendi, Annu. Rev. Mater. Sci. 30, 545, 2000.
Capping Quantum Dots • Due to the extremely high surface area of a nanoparticle there is a high quantity of “dangling bonds” • Adding a capping agent consisting of a higher band gap energy semiconductor (or smaller) can eliminate dangling bonds and drastically increase Quantum Yield The Making With the addition of CdS/ZnS the Quantum Yield can be increased from ~5% to 55% Synthesis typically consisted of lower concentrated of precursors injected at lower temperatures at slow speeds Shinae, J. Nanotechnology.2006, 17, 3892
Quantum Dot Images • Quantum dot images prepared in the Searson Lab using CdO and TOPSe with a rapid injection 455000x The Making 770000x 560000x
Quantum Dot Ligands Provide new Insight into erbB/HER receptor – Mediated Signal Transduction • Used biotinylated EGF bound to commercial quantum dots • Studied in vitro microscopy the binding of EGF to erbB1 and erbB1 interacts with erbB2 and erbB3 • Conclude that QD-ligands are a vital reagent for in vivo studies of signaling pathways – Discovered a novel retrograde transport mechanism Application QD’s Dynamics of endosomal fusion A431 cell expressing erbB3-mCitrine Nat. Biotechnol. 2004, 22; 198-203