Download
1 / 16
160 likes | 267 Views
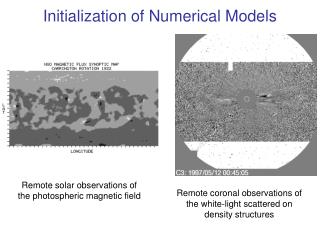
An Overview of Stream Depletion and How It Is Determined Using Numerical Groundwater Flow Models. Clint Carney – NPPD/COHYST Technical Committee North Platte NRD Board Meeting April 10th, 2003 Bridgeport, NE. What Is Stream Depletion ?.

E N D
An Overview of Stream Depletion and How It Is Determined Using Numerical Groundwater Flow Models Clint Carney – NPPD/COHYST Technical Committee North Platte NRD Board Meeting April 10th, 2003 Bridgeport, NE
What Is Stream Depletion ? Jenkins (1968) defines stream depletion as “direct depletion from the stream or reduction of return flow to the stream” In other words…… • “Pulling” water directly from the stream into the aquifer towards a pumping well or other sink • Removing water from the aquifer that would eventually reach the surface water feature
Jenkins Method for Determination of Stream Depletion • Analytical technique used to determine stream depletion in many early analyses • Uses many assumptions that may not hold true in the real system • Does not account for complex geology or other hydrologic features
Groundwater Flow Models Applied to Stream Depletion • A more technical alternative to the Jenkins Equation for determining stream depletion • Groundwater models can account for – • Complex geology and hydrologic characteristics • Variable pumping regimes • Better representation of the overall system
What is a Groundwater Flow Model? • Numerical representation of the real-world system using computer processors to solve groundwater flow equations • Simplification of the real system that accounts for: • Geologic strata • Hydrologic conditions • Climatic conditions • Historic conditions • Prediction capabilities
Example of a Groundwater Model Simulation • Transient Simulation – 40 years • 3 layer model representing typical geology found in the Platte Valley • No pumping wells simulated
Example of a Groundwater Model Simulation (cont.) • Same model as previously shown • Now includes 14 pumping wells screened in Layer 3 (Ogallala Group) • Pumping rate set to 500 gallons per minute for each well
How Does a Groundwater Model Determine Stream Depletion? CALIBRATED FLOW MODEL SIMULATE PUMPING CALCULATE DEPLETION
How Does a Groundwater Model Determine Stream Depletion? • Simple process of determining water balances calculated by the flow model • Over any specified time, the stream depletion caused by a well(s) can be calculated for any pumping rate • Percent of depletion determined by volume of depletion/volume of water pumped from the aquifer. • Stream depletion line determined when specified time of pumping has caused and X percentage depletion to the stream
Example of Stream Depletion Values in Relation to Proximity of a River • “Mock” flow model • 40-year simulation • Pump rate at 500 gallons/minute for 120 day interval • No pumping during remainder of year
Effects of Variation in Pumping Rates • 1 pumping well • 4 miles from river • Simulation Statistics • 40 years • Test rates/duration • 500 gal/min for 120 days • 1,000 gal/min for 60 days
Effects of Variation in Pumping Rates After 40 Years…. Each pumping rate produced 10,690 acre- feet of water. Reduction in simulated stream flow – 3,021 acre-feet (28% of pumped volume)
What About More Than One Well? Another 40 Years…. Two wells pumping 500 gal/min (~1 cfs) daily for 120 day pumping period Wells 1 mile apart Total volume pumped – 21,379 acre-feet Reduction in simulated stream flow – 6,250 acre-feet 29% of pumped volume 30% Depletion New Well 28% Depletion Old Well
In Conclusion…. • COHYST will produce lines delineating 28% depletion over 40 years throughout the entire study area using calibrated multi-layer groundwater flow models • Stream depletion is an affect of volume of water removed from aquifer over time • If volume of removal is constant, stream depletion is independent of pumping rate or duration of pumping period • Distance of the stream depletion lines to the river will vary depending on local hydrologic properties of the aquifer