Download
1 / 19
200 likes | 207 Views
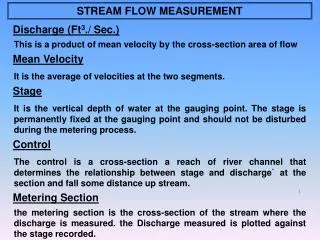
Simulation of stream flow using WetSpa Model. Niroj Kumar Shrestha Department of Civil Engineering Utah State University. Introduction. The WetSpa is a spatial hydrological rainfall runoff model.

E N D
Simulation of stream flow using WetSpa Model Niroj Kumar Shrestha Department of Civil Engineering Utah State University
Introduction • The WetSpa is a spatial hydrological rainfall runoff model. • Used for forecasting the effects of the spatial variable inputs and outputs by linking with GIS. • Input in the WetSpa are physical control like DEM, Soil type and Land use map and hydrometrological data like Precipitation, Evapotranspiration and Temperature • The main output is the discharge.
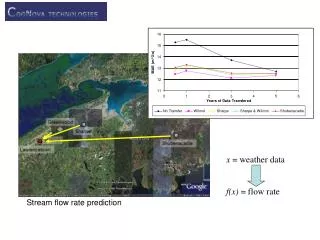
Study area • Margecany-Hornad river basin with area 1131 Km2. • Daily hydro-meteorological data from 1991-2000.
Base map for wetspa model • Digital elevation model (DEM) • Land use map • Soil type map
Principle maps The soil is classified according to USDA into 12 classes as texture categories of loam, sandy loam, silt loam, silt clay loam, clay loam, sandy clay loam and loamy sand, sandy clay and clay loam.The soil mostly contains some fraction of loam. Hilly topography around the catchment boundary with elevation ranging from 332 to 1556 m
Some description of given data • The evergreen needle is concentrated close to the catchments boundary. • Mix farming and grass are concentrated around the flat central part of the catchments.
Deriving some maps and parameters • The DEM is used for deriving stream characteristics like the slope, hydraulic radius, stream order, flow accumulation, flow direction, stream link.
Deriving maps and parameters... • From the Soil type map the characteristics of the soils like initial moisture, porosity, residual moisture, conductivity, wilting point and field capacity among others are obtained. • From the land use map parameters like root depth and Manning’s coefficient are derived. • Other maps like runoff coefficient were obtained from the DEM, Soil type and Land use.
Hydrological data preparation • Basic data required are: precipitation, potential evaporation, temperature and measured discharge. • All these data should be in same time scale and same period.
Thessien polygon for precipitation, evapotranspiration and temperature
Some relations used in wetspa Excess rainfall Interflow Base flow
Global model parameters • To make the calibration process simple and user friendly, Wetspa has summarized calibration in 12 global parameters. • Correction factor for potential evapotranspiration. • Scaling factor for interflow • Groundwater recession coefficient • Initial moisture content. • Initial groundwater storage. • Temperature degree-day coefficient. • Rainfall degree-day coefficient. • Surface runoff coefficient for near zero rainfall intensity. • Rainfall intensity corresponding to surface runoff exponent of 1
Model Calibration • Calibration process involves comparison of simulated discharge with measured discharge. • Done by adjusting input parameters and evaluating output. • The results of this statistical assessment are evaluated by a set of output parametersC1, C2, C3, C4 and C5.
Continue... C1 is modal bias and best value is 0 C2 is model confidence and best value is 1 Logarithmic version of Nash-Sutcliffe efficiency for low flow and best value is 1 Nash sutcliffe efficiency and best value is 1 Nash-Sutcliffe efficiency for high flow and best value is1
Continue... • Several trials were performed till the reasonable values of Ci were obtained. • The best values obtained after calibration are: • C1 = 0.025, C2 = 0.949, C3 = 0.738, C4 = 0.724 and C5 = 0.762 • Corresponding input parameters at final calibration: Ki= 4, Kg=0.005, K_ss=1.0, K_ep=0.803, G_0=5.15, G_max=35.33 T_0= 0.001, K_snow=0.8, K_rain= 0.15, K_run=6, P_max=0.762. • The parameters which are more sensitive to calibration process are found as Ki, Kg, G_0 and G_max.
Graphical comparison between simulated and measured discharge Comparison of simulated and measured discharge. The difference might be due to error in the measurement of the discharge in field and some error in the model assumption. However the result of the model is satisfactory.
Conclusion • Wetspa is hydrological model which was used to simulate the stream flow for Margecany-Hornad river basin . • Data Requirements are DEM, Soil type and Land use and hydrometrological data. • Other maps were derived from above three maps. • Can be calibrated using 12 input global parameters. • Its performance was evaluated graphically and in terms of C1, C2, C3, C4 and C5 as well. • Found that the simulated result was close to observed flow.