Download
1 / 17
170 likes | 256 Views
Conservation Score Coefficient (CSC). Does the choice of CSC improve gene prediction in ISCAN? Rachel Pusey 27 July 2005. Value added prediction. Conservation sequence Mouse:••││-││-••. ISCAN. Prediction. Target DNA sequence Human: TATTCAG. Informant sequence(s) Mouse: GGACGTG

E N D
Conservation Score Coefficient (CSC) Does the choice of CSC improve gene prediction in ISCAN? Rachel Pusey 27 July 2005
Value added prediction Conservation sequence Mouse:••││-││-•• ISCAN Prediction Target DNA sequence Human: TATTCAG Informant sequence(s) Mouse: GGACGTG Chicken:GTACGAG NSCAN
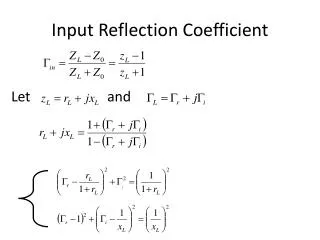
What is the CSC? In the midst of the Viterbi algorithm: • log likelihood used to decide the most likely state for this base/position • normally just for the DNA target sequence • in NSCAN/ISCAN also have the informant/conservation sequence(s) • combine the two log likelihoods: just add them together
What is the CSC? ISCAN log(Ts(i)/Tnull(i)) + CSC • log(Cs(i)/Cnull(i)) T : target DNA C : conservation CSC : conservation sequence constant NSCAN log(Ts(i)/Tnull(i)) + PSC • log(Is(i)/Inull(i)) T : target DNA I : informant PSC : phylogenetic sequence constant
NSCAN results • Results already calculated for NSCAN, showing how prediction accuracy varied with PSC. • Noticable improvement for values ~0.4 i.e. less influence for the informants. Ref: Using Multiple Alignments to Improve Gene PredictionSamuel S. Grossand Michael R. Brent
What about ISCAN? • Alter current version of ISCAN/zoe code • only need to change half a dozen lines • (CVS not updated) • Run on the human genome • parameter source • /bio/pkg/parameter/human/human_iscan_utr.zhmm • DNA source • /bio/pro/Homo_sapiens/assembly/hg17/chr_split/<chr#>/fragment_<frag#>/<frag#>.seq.masked
The usual pipeline • Run modified ISCAN on 1MB fragments → gtf output • Run unsplit_twinscan_gtf.pl to glue the fragments back together • Run evaluate_gtf.pl on individual chromosomes, also on aggregate lists • source for gtf for evaluation • /bio/db/Homo_sapiens/assembly/hg17/annotation/refseqs_v2/chr<chr#>.eval.gtf
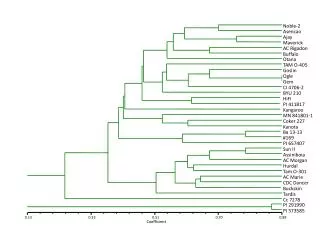
Summary • Less pronounced effect for CSC than PSC • Peak around 0.6-0.7 • Considerable variation between chromosomes e.g. • chr1 similar to aggregate, smooth curve • chr13, chrY flat with noise
Conclusion? • Haven't been missing out on the panacea for all ills – or at least this isn't it.