Download
1 / 5
50 likes | 170 Views
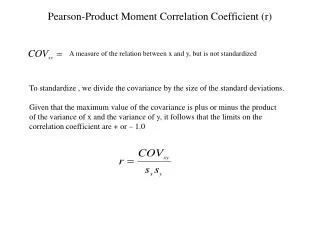
A least squares fit of some data collected gives the model What is the estimate increase in y that corresponds to an increase of 7 in x?. Correlation coefficient r. Correlation measures strength of 2 quantitative variables. Tells us how close the data is to being linear

E N D
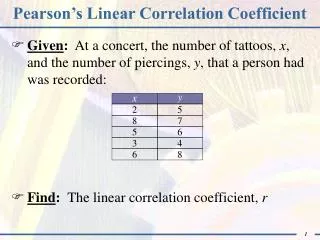
A least squares fit of some data collected gives the model What is the estimate increase in y that corresponds to an increase of 7 in x?
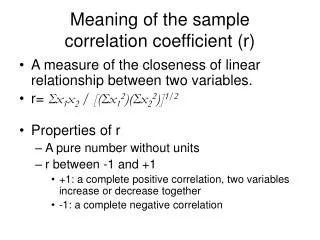
Correlation coefficient r • Correlation measures strength of 2 quantitative variables. • Tells us how close the data is to being linear • Have we ever changed r to a percent….. NO! • So don’t do it on the test
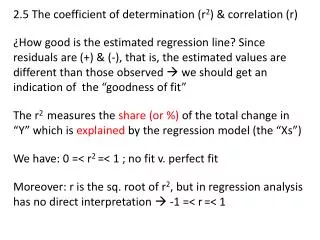
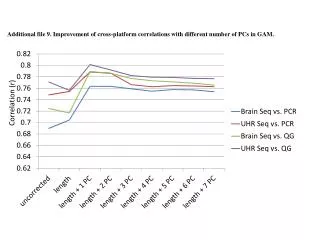
gives a measure of how successful the regression was in explaining the response. • % of the variation in either variable is the fraction of the variation in the values of y that is explained by the least-squares regression of y on x
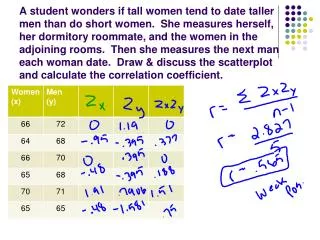
Resistance measures • Plain and simple: the least square regression and correlation coefficient are NOT RESISTANT. • In other words they are easily influenced by unusual or extreme values. • See pg. 171-172
Residual • residual= observed -predicted