Download
1 / 15
760 likes | 3.02k Views
Coefficient of Variation. The standard deviation divided by the mean *Shows variation relative to the mean. For samples: CVar =. s. ___. _ X. *100%. Comparing Coefficient of Variation. Stock A: Average price last year = $50 Standard deviation = $2 Stock B:

E N D
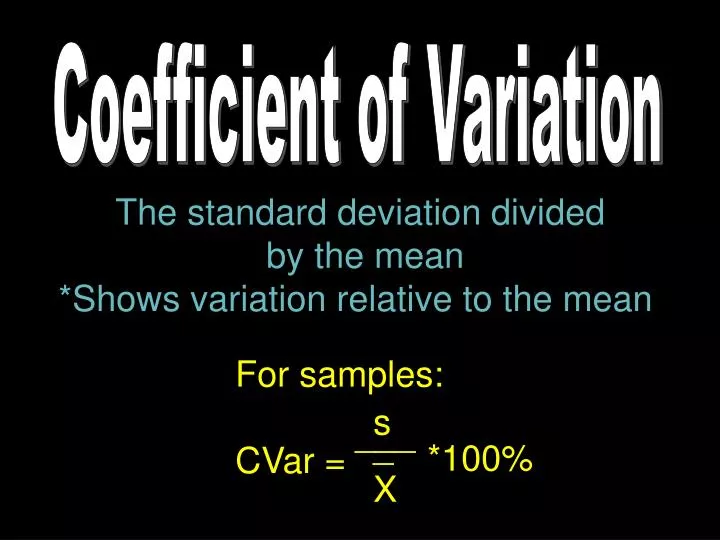
Coefficient of Variation The standard deviation divided by the mean *Shows variation relative to the mean For samples: CVar = s ___ _ X *100%
Comparing Coefficientof Variation • Stock A: • Average price last year = $50 • Standard deviation = $2 • Stock B: • Average price last year = $100 • Standard deviation = $5 • Coefficient of Variation: • Stock A: • Stock B:
The mean of the number of sales of cars over a 3-month period is 87, and the standard deviation is 5. The mean of the commissions is $5225, and the standard deviation is $773. Compare the variations of the two. CVar: 5/87 *100 = 5.7% CVar: 773/5225 * 100 = 14.8%
The Empirical Rule Note that the empirical applies only to bell-shaped distributions. The empirical Rule states that • Approximately 68% of the data values fall within one standard deviation of the mean • Approximately 95% of the data values fall within 2 standard deviations of the mean • Approximately 99.7% of the data values fall within 3 standard deviations of the mean
The Empirical Rule ~ 68% of the Observations Fall Within (±) 1 Standard Deviation Around the Mean 68% -1sd µ +1sd
The Empirical Rule ~ 95% of the Observations Fall Within (±) 2 SD Around the Mean 95% -2sd -1sd µ +1sd +2sd
The Empirical Rule ~ 99.7% of the Observations Fall Within (±) 3 SD Around the Mean 99.7% -3sd-2sd -1sd µ +1sd +2sd +3sd
Assume you have a bell-shaped distribution of test scores with a mean of 82 and a standard deviation of 6. -What percent of the data scores were above a 76? -68% of the data fall between what two scores?
Chebyshev's Theorem The proportion of values from a data set that will fall within k standard deviations of the mean will be at least 1 ____ k2 1 - Where k is a number greater than 1 *k is not necessarily an integer
The temperature in Miami, FL was recorded for a month at 2:00 daily 80, 90, 88, 87, 85, 76, 77, 84, 91, 90, 86, 85, 83, 77, 85, 86, 81, 86, 92, 90, 79, 83, 84, 82, 88, 89, 85, 78, 82, 86
What percent of values fall within 2 standard deviations of the mean? Use: 1 – 1/k2 with k =2 1-1/22 = 1 – ¼ = 75%
What percent of values fall within 3 standard deviations of the mean? Use: 1 – 1/k2 with k =3 1-1/32 = 1 – 1/9 = 88.9%
What percent of values fall within 2 standard deviations of the mean? Use: 1 – 1/k2 with k =4 1-1/42 = 1 – 1/16 = 93.8%
A sample of the labor costs per hour to assemble a certain product has a mean of $2.60 and a standard deviation of $0.15. Using Chebyshev’s theorem, find the range in which at least 75% of the data values will fall.