Download
1 / 14
510 likes | 1.69k Views
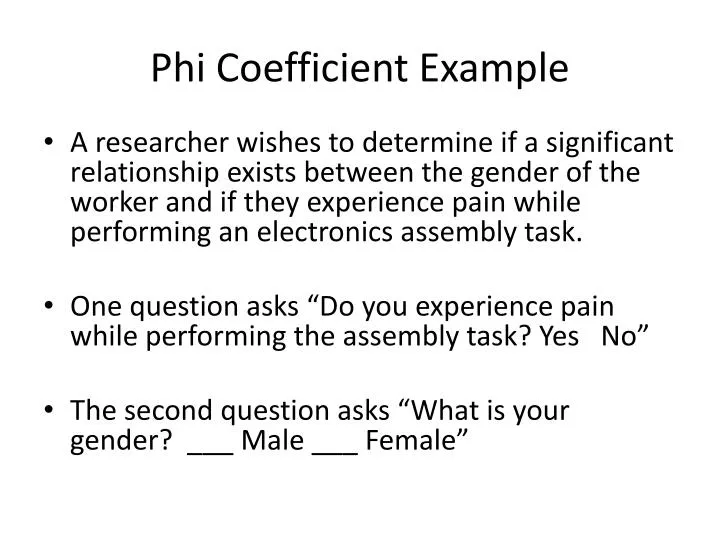
Phi Coefficient Example. A researcher wishes to determine if a significant relationship exists between the gender of the worker and if they experience pain while performing an electronics assembly task. One question asks “Do you experience pain while performing the assembly task? Yes No”

E N D
Phi Coefficient Example • A researcher wishes to determine if a significant relationship exists between the gender of the worker and if they experience pain while performing an electronics assembly task. • One question asks “Do you experience pain while performing the assembly task? Yes No” • The second question asks “What is your gender? ___ Male ___ Female”
Step 1: Null and Alternative Hypotheses • Ho: There is no relationship between the gender of the worker and if they feel pain while performing the task. • H1: There is a significant relationship between the gender of the worker and if they feel pain while performing the task.
Step 1A: Determine dependent and independent variables and their formats. • Gender is dichotomous, independent • Feeling pain is dichotomous, dependent
Step 2: Choose test statistic • Phi Coefficient
Step 3: Choose Alpha Level • Use Alpha Level = .05 • Interpreted as “There is a 5% chance that a significant relationship really does not exist although the results indicate one does (5% chance of committing a Type I error or stated as 5% chance of rejecting the Null hypothesis when in reality it is false).
Step 4: Determine the Critical Score • For the Phi Coefficient, the critical score is determined using a Chi Square Table. • The first column is the Degrees of Freedom and the other columns are the Alpha levels. • The degrees of freedom for the Phi Coefficient is equal to 1.00 • (Rows-1)(Columns-1)= (2-1)*(2-1)=1.00 • At .05 and DF = 1.00, the critical score is 3.84
Step 5: Run the Test • The Phi Coefficient should be set up as follows: • Box A contains the number of Males that said Yes to the pain item • Box B contains the number of Females that said Yes to the pain item • Box C contains the number of Males that said No to the pain item • Box D contains the number of Females that said No to the pain item
Step 6: Compare your score to the critical score • To interpret the .17, you need to convert it to a Chi Square value. • To do this, multiply N X (Phi Coeff)2 • If the obtained score is greater than the critical score, reject the Null and accept the alternative. • In this example, 29 X .172 = .84 • Since .84 is less than 3.84, do not reject the Null Hypothesis.
Step 7: Conclusions • There is no significant relationship between the genders of the workers and if they feel pain while they perform the task. • Both males and females have pain (or no pain) at equal frequencies.