Download
1 / 26
290 likes | 354 Views
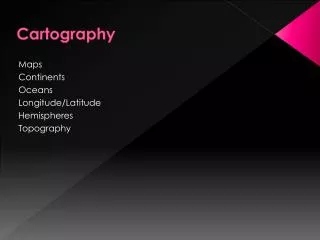
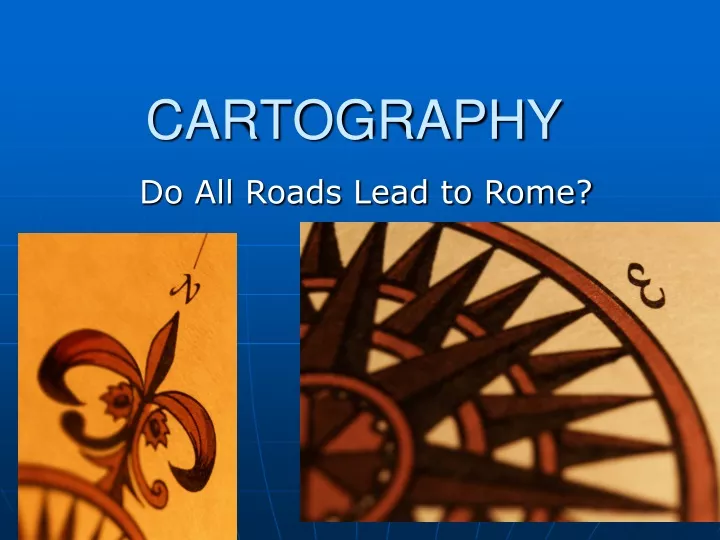
CARTOGRAPHY. Do All Roads Lead to Rome?. Circle Graph. Bar Graph. Where Do Maps Fit into Geography?. Chart. Line Graph. Shows relationships between two sets of information When all points are made, a line is drawn connecting the points Quick idea of trends or directions. Bearing.

E N D
CARTOGRAPHY Do All Roads Lead to Rome?
Line Graph • Shows relationships between two sets of information • When all points are made, a line is drawn connecting the points • Quick idea of trends or directions
Legend or Key is used to use symbols to represent something else
Scale • Defines the relationship between distance on the map and corresponding distance on the earth. • Units of measure on bottom of the map
History of Maps • Earliest Babylonians 2300 BC cut into clay tiles • China developed maps on silk around the 2nd Century BC • Anaximander made the first map to represent the known world 6th Century BC—circular form and showed lands around Aegean Sea
History of Geography • Considered by many as the “Father of Geography” • Developed a system of latitude and longitude • First to calculate the circumference of the Earth • Map with latitude and longitude developed in 200 BC
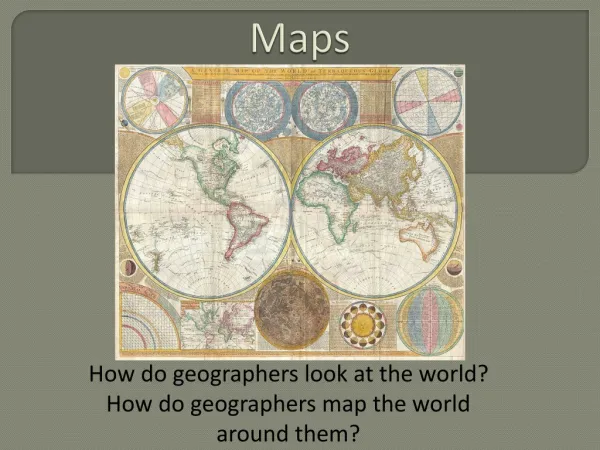
Maps • Maps are representations of an area of the Earth or space. • Atlas is a collection of maps bound together • Sextant invented in 1730 by John Hadley and Thomas Godfrey: using a telescope, horizon and sun or another celestial body, the sextant measures the angle between the horizon and the celestial body--Helps to determine latitude. • Compass points to magnetic north pole
Maps • Oldest map 2700 BC from Sumerians on clay tablets • Oldest map drawn to scale by Greek geographer Anaximander in 6th Century B.C.E., placed Greece in the center
Ptolemy’s Map • From Alexandria • Published around AD 150 • Earliest map to use mathematically accurate forms of conic projection
History of Maps • After Rome fell, Europe did not produce maps • Arabian geographer, al-Idrisi made a map of the world in 1154 • 15th Century Paolo de Pozzo Toscanelli among first scholars to state that ships could reach Asia by sailing west from Europe
History of Maps • During 16th Century, Flemish geographer Gerardus Mercator devised a projection for his map of the world used by navigators • Published 3 volumes of maps, collected data and refined map making methods
Early Maps • Told about topography of a country or area in relation to the navigator’s country
Topographical Maps • General Locations and political boundaries • Land and cultural features • Cross-Section
Relief Map • Gives a 3-D view of geographic features • Used by Engineers and Military
Cylindrical Projection • Paper cylinder around a globe • Shape of continents near the middle are most accurate • Regions near the poles are stretched out of proportion
Azimuthal Projection • Piece of paper over a globe at one point • Useful in viewing polar regions because they are in the center of the paper. • Distortion increases as longitudinal lines move toward the Equator
Conic Projection • Cone over globe • Map free of distortion in the middle latitude regions
Goode Projection • 1923 by J. Paul Goode, a geographer and cartographer from the University of Chicago • Earth drawn in irregular joined parts • Minimal distortion of land masses • Used for thematic maps
Robinson Projection • Orthophanic Projection • Transfers information from a round globe to a flat surface • Elliptical in shape and shows world on a single plane • Poles are lines instead of points • Designed in 1963 by Arthur H. Robinson of University of Wisconsin • Minimizes distortion, especially near Equator • This is the most widely used today.
Modern Mapping • Satellites capture images of the Earth’s weather patterns, growth of cities, health of plants, and buildings and roads
Review Questions • What is Cartography? • What are three types of projections and what are they used for? • What is the significance of the topographical thematic type of map for the military? • What are 5 characteristics of all maps? What do they have on them? • What is climate and why is it important to understand? • Know 5 U. S. states and their capitals for the weekly quiz (from the 13 you have already learned)