Download
1 / 29
300 likes | 347 Views
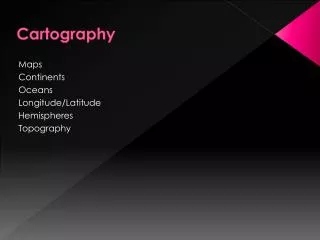
Cartography. Cartography. What is Cartography? The science of Map Making. Been around for centuries. For humans as a reference to find their way. What is a map made up of? Many components and way they are displayed. Cartography and Latitude.

E N D
Cartography • What is Cartography? • The science of Map Making. • Been around for centuries. • For humans as a reference to find their way. • What is a map made up of? • Many components and way they are displayed.
Cartography and Latitude • Geographic Grid – series of imaginary lines that are inscribed on the Earth for purposes of designating location. • Latitude – known also as parallels. Always written down first on a map. Equidistant. • Equator is a popular parallel of Latitude. • Location is measured in terms of Latitude north or south of the equator.
Longitude • Longitude – Also known as Meridians. • Prime Meridian – is the most famous line on Longitude. • Not equidistant. • Coverage to North and South Poles. • Bulge at the equator. • International Dateline is a Meridian.
Facts about the Earth • Earth Spins on its axis. • Ends of the Axis are North and South poles. • Earth is tilted at 23.5 degrees. • Tropic of Cancer 23.5 degrees North • Tropic of Capricorn 23.5 degrees South. • The tilt is called an Inclination. • Inclination varies sunlight making seasons.
Inclination Results • Winter Solstice – First Day of Winter for Northern Hemisphere. • Shortest day of the year for Northern Hemisphere. • Antarctic Circle 24 hrs. of daylight. • 12/21
Inclination Results • Vernal Equinox – Everywhere on the planet, 12 hours of daylight and 12 hrs of night. • Direct rays shine on equator. • 3/21
Inclination Results • Summer Solstice – First Day of Summer for Northern Hemisphere. • Longest day in the Northern Hemisphere. • Antarctic Circle 24 hrs. of Night. • 6/21
Inclination Results • Autumnal Equinox - Everywhere on the planet, 12 hours of daylight and 12 hrs of night. • Direct rays shine on equator. • 9/22
Ways to make maps • The Ancient Greeks knew the equator existed but it was not actually located until the 16th or 17th century; it was found via position of sun rays. • Plane Table Survey – time consuming, old school, take measurements of field work.
Ways to make maps • Computer Cartography – utilizes GPS (global positioning satellite). • Latitude and longitude calculated immediately. Ex. Onstar and Magellan. • GIS ( geographic information systems) – computer generated maps, easy to modify. • Remote sensing – data for maps collected via aerial, satellite, radar, or heat sensing instruments. Most data gathered this way.
NASA's Cassini spacecraft Enceladus, one of the moons of Saturn.
GPS Onstar
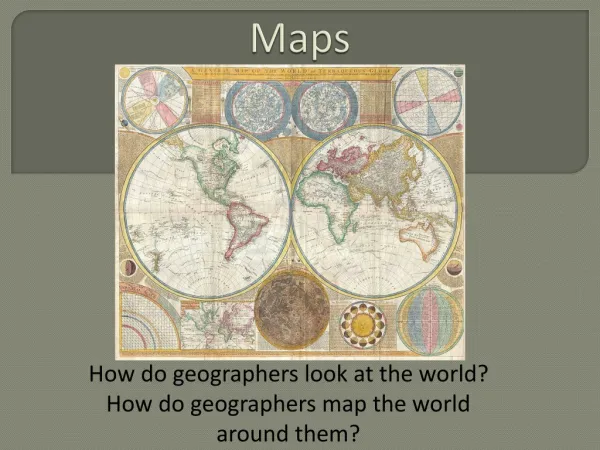
Transferring the spherical earth to a flat sheet of paper. This is necessary because the Earth is curved and a map is usually a flat surface. Oldest type of projection is Mercator projection. First World Maps followed this projection. Map Projections
Map Scale • Map scales are related to how much detail the map is showing. Large Scale Small Scale
Topographic Maps • A two-dimensional representation of a three-dimensional land surface. • It shows the three-dimensional information( relief or height variation) by using contour lines to represent elevations of hills and valleys. • These maps are used for various purposes.
Map Displays • Cartogram – related usually to quantitative data. Population Voting Internet Users
Map Displays • Thematic map – shows attributes of the world that can not be seen from a visual view of the Earth. • Ex. Population density or number of exports.
Map Displays • General Map – basic map that usually just displays cities or maps for the average person.
What do you do? • What happens when you have no map? • Old explorers and navigators used the sun and stars. • Very reliable, have barely moved in thousands of years of existence. • Landmarks are excellent way to track your progress in an area. • Ex. rice piles left behind.