Download
1 / 36
440 likes | 738 Views
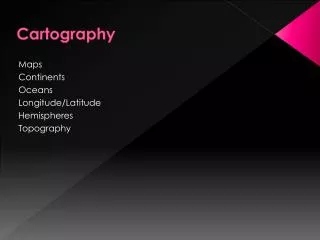
Cartography. Map Design and Type. Figure 12.1. Design Evaluation. A map should be suited to the needs of its users A map should be easy to use. Maps should be accurate, presenting information without error, distortions or misrepresentations

E N D
Cartography Map Design and Type
Design Evaluation • A map should be suited to the needs of its users • A map should be easy to use. • Maps should be accurate, presenting information without error, distortions or misrepresentations • The language of the map should relate to the elements or quantities being represented • A map should be clear, legible and attractive. • Many maps would ideally permit interaction with the user allowing change updating and personalization.
Subjective Elements of Design (Karssen) • Generalization – beauty of simplified shapes • Symbolization – beauty of graphic representation • Color – beauty of color accent and balance • Layout – beauty of composition • Typography – beauty of typographic appearance
Figure 12.4 Design Levels on The Map • In GIS we often work with Data Layers • In Cartography Levels are similar, but help the map designer organize the map by importance. • A single element should never be assigned to more than one level.
Map Composition • Forces the designer to organize the visual material into a coherent whole to facilitate communication, to develop an intellectual and visual structure • Stresses the purpose of the map • Directs the map reader’s attention • Develops an aesthetic approach for the map • Coordinates the base and thematic elements of the map—a critical factor in establishing communication • Maintains cartographic conventions consistent with good standards. • Provides a necessary challenge for the designer in seeking creative design solutions.
Balance and Visual Weight • Balance involves the visual impact of the arrangement of image units in the map frame. • Visual balance results from two major factors: weight and direction (size and location for the elements).
Visual Weight • Location • Center less weighted than edges • Upper heavier then lower • Right heavier than left • Size – larger is heavier • Color – Red, bright, isolated, unusual • Shape – regular shape, compact
Visual Direction • Location • Weight of an object attracts others and creates a neighborhood, thus giving direction • Shapes and or subject matter of objects create an axes that impart direction • The map content is more important than the map’s design
Figure 12.9 Focus of Attention
Contrast and Design • Line Contrast • Texture Contrast • Value Contrast • Variation of Detail • Color Contrast
Acuity • Visual Acuity – Size Threshold. The ability to see an object on the paper • Resolution Acuity – Detectable seperation The ability to see two objects as to objects.
Figure 12.14 Visual Hierarchy The visual hierarchy is the intellectual pan for the map and the eventual graphic solution that satisfies the plan.
Creating a Visual Hierarchy • Grouping • Grouping by Shape • Grouping by Size • Proximity • Figure Ground Relationship • Closure or interruption • Gradicule • Grayscale or Color change
Figure 12.17 Grouping by Similarity
Figure 12.18 Grouping by Size
Figure 12.19 Perceptual Grouping by Proximity
Figure 12.20 Closure
Figure 12.21 Greyscale
Figure 12.22 Interposition