Download
1 / 42
420 likes | 505 Views
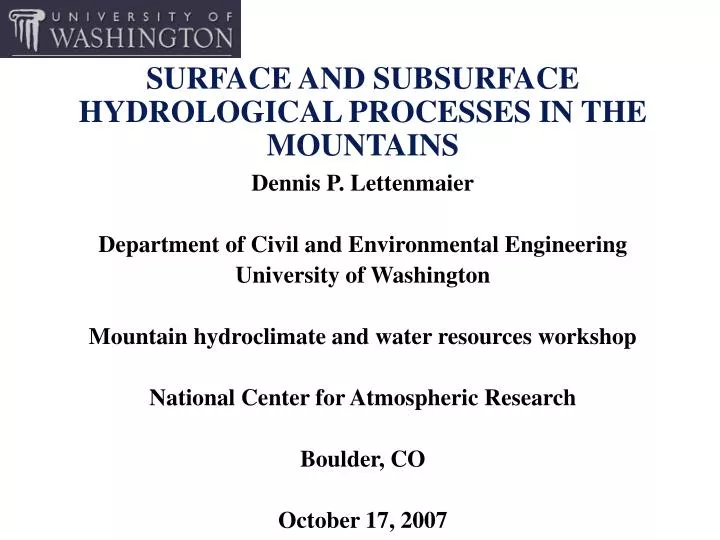
Dennis P. Lettenmaier Department of Civil and Environmental Engineering University of Washington Mountain hydroclimate and water resources workshop National Center for Atmospheric Research Boulder, CO October 17, 2007. SURFACE AND SUBSURFACE HYDROLOGICAL PROCESSES IN THE MOUNTAINS.

E N D
Dennis P. Lettenmaier Department of Civil and Environmental Engineering University of Washington Mountain hydroclimate and water resources workshop National Center for Atmospheric Research Boulder, CO October 17, 2007 SURFACE AND SUBSURFACE HYDROLOGICAL PROCESSES IN THE MOUNTAINS
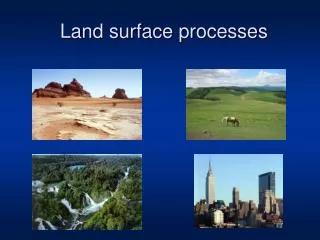
Surface Characteristics Topography Soils Vegetation Surface meteorological drivers Precipitation Temperature Solar Radiation Wind Land surface hydrological processes Snow Subsurface hydrology Runoff generation Evapotranspiration Hydrologic observations in mountain environments Implications at the large scale – Colorado River climate sensitivity Processes and variables considered
Topography and vegetation, Puget Sound drainage basin, Washington
Reynolds Creek Experimental Watershed vegetation, from field observations (left) and classified imagery (right) from Seyfried et al, WRR 2001
Topography and soil depth, Upper Billabong Creek Catchment, NWS, Australia visual courtesy CSIRO
PRISM annual precipitation climatology, western U.S. (visual from NOAA/NWS)
PRISM monthly maximum temperature map, Sep, 2007 Source: www.prism.orgegonstate.edu
Annual mean beam radiation (MJ/m2/day, Mt. Jumbong region, Korea from Kang et al, Can. J. For. Res., 2002
Downward solar radiation as a function of spatial averaging scale, Green Lakes Basin, Niwot Ridge, CO (2 PM, Apr 1) Visual courtesy Danny Marks
Wind and snow accumulation factor, Reynolds Mountain East, for wind direction 230 degrees from Winstral and Marks, HP, 2002
Partial snow coverage – Reynolds Creek Experimental Watershed (photo courtesy Danny Marks)
Energy balance over mountain snowpack, San Juan Mountains, CO, Spring 2005 from Bales et al, WRR, 2006
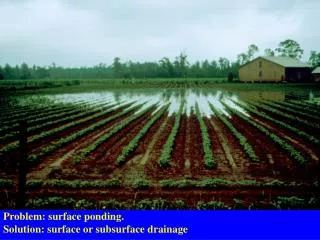
Runoff generation – the saturation excess mechanism Saturated area (source: Dunne and Leopold)
Expansion of saturated area during a storm (source: Dunne and Leopold)
Simulated depth to water table, Green River basin, Washington, Jan – July, 1996
The importance of seasonal changes in surface energy fluxes -- Distributed model spatial average (ADM) latent heat flux,, as compared with macroscale equivalent model (MSE) ADM MSE - ADM From Arola and Lettenmaier, J Clim, 1996
Colorado River basin climate sensitivities as a case study: Why don’t GCM projections match those of hydrologic models? Concluding comments – why small scale hydrologic processes matter at the large scale
P-E (from Seager et al 2007) Co River discharge (from C&L, 2007)