Download
1 / 34
340 likes | 468 Views
Unsupervised models and clustering. Table of contents. Introduction The unsupervised learning framework Self Organizing Maps (SOMs). Introduction 1.

E N D
Table of contents • Introduction • The unsupervised learning framework • SelfOrganizing Maps (SOMs)
Introduction 1 • In order to efficiently mimic the nervous system, it is necessary to get an idea of the nature of the biological processes that actually take place in the brain • The only reasonable assumption is that they are driven by mechanisms aimed at optimizing the target they have to pursue • Each cognitive process evolves from an initial situation associated to a stimulus, up to a terminal state in which a response is produced, which is the result of the process itself • It is intuitive that, in this evolution, there is a sort of information transfer
Introduction 2 • In fact, it is just the initial stimulus that provides the information necessary to obtain the desired response Such information must be transmitted and preserved until the conclusion of the process • A reasonable way for interpreting the processes that take place in the nervous system is therefore to consider them as transfers of information that follow a “maximum conservation” criterion
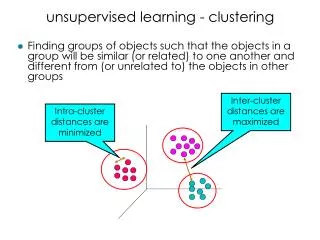
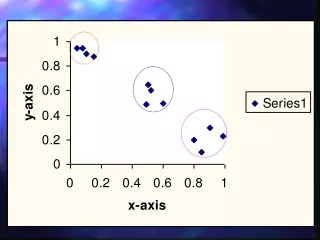
The unsupervised learning framework 1 • Sometimes, in realworld applications, we do not have sufficient knowledge on the problem to be solved in order to entrust to the supervised learning paradigm, i.e. we do not know the solution to the problem, albeit sampled on a set of examples, just having at disposal only data to be analyzed and interpreted, without an a priori ”guideline” of specific information on them • A classic problem of this class is to highlight some data groups, with common characteristics, within a “disordered and miscellaneous” set • This problem ca be addressed by using a selforganizing neural network capable of learning data without a supervisor which provides solutions at specific points in the weight space
The unsupervised learning framework 2 • Learning without supervision means aggregating “similar” examples in topologically neighboring regions • While in the supervised learning protocol the variation of synaptic connections is done in an attempt to minimize the error with respect to the information provided by the supervisor, in this case, the learning procedure is guided by “similarity” criteria, inherently present within the data
The unsupervised learning framework 3 • An unsupervised learning example: the Hebb rule • Hebb (1949): if two connected neurons are active at the same time, the force (or the weight) of their connection is increased • The connection weight changes by an amount proportional to the product of the activation values of the two neurons with the weight itself, thus tending to “strengthen” the strongest links and to “weaken” the weakest ones • More realistic, from the biological point of view, with respect to BackPropagation
The unsupervised learning framework 4 • Summing up… • Given a set of examples we want to find something interesting • The experience is given by the collected “examples” • The problem is that of “finding something interesting…” • Without any information other than the data itself… • The performance depends on how “interesting” is the obtained result
Selforganizing networks 1 • In the central nervous system, the ganglion cells, which constitute the output stage of the retina, are organized according to receptive fields, sensitive to particular stimuli • In the auditory system cortex, neurons and fibers are anatomically arranged in an orderly manner with respect to the acoustic frequencies • Studies on brain maps during the prenatal stage, i.e. in the absence of sensory stimuli, have demonstrated that, in the lower levels, the neural structure is genetically predetermined, while at higher levels the organization matures and emerges as a result of the learning from examples process
Selforganizing networks 2 • Trivially, it can be observed that when children learn to read, mark the letters one by one and “think” while reading; in adults, however, whole words and sentences are recognized at a glance • This shows that there is a kind of cerebral selforganization, that develops the brain power to classify and easily recognize some “common” patterns, which is also confirmed by the difficulty of reading a text upside down or containing attached words
Selforganizing networks 3 • Studied by Grossberg, Von Malsburg, Rumelhart, Zipser and Kohonen since the mid ‘80s, self organizing neural networks are particularly indicated in those applications where there is no a priori knowledge on how to process certain information, so that the network is expected to automatically “discover” interesting concepts within the “data population” • Both the stimulus and the network response are characterized by a given number of components, describing points in appropriate spaces
Selforganizing networks 4 • The learning process can be interpreted as a geometric transformation from the input to the output space • The output space has a size smaller than that of the input space, since the stimulus normally contains the information required to activate many simultaneous processes • Compared to a single one, it is redundant • This means that during selforganization, it is always present an operation of redundancy reduction • In both the input and the output space, typical regions are evinced to which the information is associated
Selforganizing networks 5 • The natural mechanism that controls the information transfer must then identify those regions, that are important for the cognitive process, and make sure that they will correspond in the transformation • Therefore, in the cognitive process, a data clustering operation is carried out, realized with the acquisition of experience • To the two operations of redundancy reduction and clustering biological evidence can be attached, based on the functioning of the nervous system
Selforganizing networks 6 Mapping from the input space to the space defined by the neurons of the selforganizing network
Selforganizing networks 7 • The main use of selforganizing networks is to perform data analysis, in order to highlight regularities among data or to classify them (they are particularly used for shape classification, in image and signal recognition) • Selforganizing neural networks are suitable for the solution of different problems with respect to super-vised learning approaches • They can be used for classification tasks, such as for handwritten character recognition or for the identification of radar signals • They are used to implement clustering, for partitioning data sets into collections of classes, or clusters containing similar patterns • They can perform data compression
SelfOrganizing Maps 1 • Biological motivation • The Kohonen network is modeled on the basis of a characteristic behaviour of neurons in laminar nervous tissues: such neurons are activated, under the action of a stimulus, in groups characterized by the presence or the absence of activity, defining as “activity” the emission of a number of pulses (per unit time) that exceeds a certain threshold • The spatial demarcation between the two groups is clear, so that we talk about the formation of “activation bubbles”, obtained starting from a situation of undifferentiated low activity of all the neurons in the network
SelfOrganizing Maps 2 • In the case of biological neurons, those neurons that are physically closer to active neurons have strong and excitatory connections while the peripheral ones have inhibiting connections • In the cerebral cortex, there are projections of sensory stimuli on specific networks of cortical neurons • The sensorimotor neurons constitute a distorted map (the extent of each region is proportional to the sensitivity of the corresponding area, not to its size) of the body surface • However, adjacent parts of the cortex correspond to adjacent parts on the body surface
SelfOrganizing Maps 4 • Kohonenmodelled this feature by restricting the variation of the weights only to those neurons that are close to a selected neuron • SOM (T. Kohonen, 1981): “sensorial” maps, constituted by a single layer of neurons, where the units specialize themselves to respond to different stimuli, in such a way that: • different inputs activate different (far away) units • topologically neighboring units are activated by similar inputs
SelfOrganizing Maps 5 • Architecture • A single layer of neurons ni,i1,…,wh(where w is the width andh the height of the map) • Each input X=[x0,x1,…,xN1] is connected with all the neurons • To each connection, a weight wijis associated • Activation function fi = 1/d(Wi,X), where dis a distance • Lateral untrainable connections
SelfOrganizing Maps 6 • The weights of each neuron are modified: • in an excitatory sense, in proportion to the value of its activation and to those of the neurons belonging to its neighborhood, and also proportionally to the distance from them • in an inhibitory sense, in proportion to the value of the activation of the neurons outside the neighborhood, and also proportionally to the distance from them • Therefore, proposing the same input to the network: • neurons that originally had a high activation value, and their neighbors, will show even a greater activation • neurons that responded little, will react even less
SelfOrganizing Maps 7 • If “welldistributed” data are presented to the network, in an iterative fashion, each neuron specializes itself in responding to inputs of a certain type • Moreover, neighboring neurons respond to “similar” stimuli projecting, in practice, the input space on the layer of neurons • Data dimenionality reduction, from N (input size) to m (map size, usually 23) • Each data is represented by the coordinate of the unit on which it is projected, that is the one that has the maximum activation, i.e. the one whose weight is more similar (closer) to the data itself
SelfOrganizing Maps 8 • Lateral interaction • The output layer neurons are connected with a “neighborhood” of neurons, according to a system of lateral interaction defined “Mexican hat” • These connection weights are not subject to learning, but they are fixed and positive in the periphery of each neuron
SelfOrganizing Maps 9 • In the output layer, a unique neuron must be the “winner” (showing the maximum activation value) for each pattern presented to the network • The winner neuron identifies the class to which the input belongs • The “Mexican hat” connections tend to favour the formation of bubbles of activation, that identify similar input
SelfOrganizing Maps 10 • In practice: • the input space is partitioned into n subspaces, if n is the dimension of the layer (in neurons) • each subspace siofS{Xk} is defined by: si{Xjt.c. d(Xj,Wi) mintd(Xj,Wt)} Voronoi tessellation
SelfOrganizing Maps 11 • Simplifications of the model to implement the training algorithm: • weights are changed only in the neighborhood of the neuron that has the maximum activation (this type of training is also known as competitive learning) • we consider only the excitatory lateral interactions within a limited neighborhood of the winner neuron • Note: changing the weights in the excitatory sense means making them more and more close to the inputs; changing the inhibitory weights causes an opposite behaviour
SelfOrganizing Maps 12 aC(alearning rate,Csmall positive constant 1) • Repeat: • For each input xibelonging to the training set: • find the winner neuron nj • update the weights of the winner neuron and of the neurons belonging to its neighborhood, as: • wj(t1) wj (t) a|xi(t1)wj (t)| • a(k1) a(k)(1g) (gsmall positive constant 1) • until the network comes to a stable equilibrium point
SelfOrganizing Maps 13 The role of learning is to rotate the synaptic weight vector to align it to the input vector; in this way, the winner neuron is even more sensitized to the recognition of a particular input pattern
SelfOrganizing Maps 14 • The SOM learning algorithm is very simple (it does not require the derivative calculation): • Neuron j*, with the weight vector closest to the input pattern, is selected; that neuron “recall” the input vector and changes its weight in order to align it with the input • Also the weight vectors of the neighboring neurons of j*are updated • the network tries to create regions consisting of a large set of values around the input with which it learns • those vectors that are spatially close to the training values will be correctly classified even if the network has never seen them before (generalization capability)
SelfOrganizing Maps 15 • The purpose of a SOM is to have, for similar inputs, neighboring winner neurons, so that each activation bubble represents a class, containing all the input data with common characteristics • The neighboring region can be chosen as a square, a circle or a hexagon around the winner neuron • The neighborhood must be chosen large, at the beginning, whereas it should slowly decrease during learning
SelfOrganizing Maps 16 • Summing up… • SOMs are able to realize data clustering, i.e. they can identify, in the input space, a set of partitions induced by the similarities/differences among data • Each partition is represented by a prototype (centroid) defined by the weights of the corresponding neuron • SOMs produce an unsupervised clustering: they do not exploit any a priori information about the classes (number and type) • After training, it is possible to label (classify) data, based on the partition of the input space to which they belong
SOMs and Bioinformatics • Gene clustering from microarray data • Prediction of microRNA target (miRNAs are small non coding RNAs that regulate transcriptional processes via binding the target gene mRNA) • Human tissue classification • DNA motif identification for extracting binding sites in DNA sequences • Prediction of the behavior of synthetic peptides in inhibiting the adhesion of human tumor cells to extracellular proteins • …
SOMs and structured data • Since additional structural information is often available in possible applications of self organizing maps (SOMs), a transfer of standard unsupervised learning methods to sequences and more complex graph structures would be valuable • Nevertheless SOM constitutes a metricbased approach, and therefore it can be applied directly to structured data if data comparison is defined and a notion of adaptation within the data space can be found