Download

1 / 16
160 likes | 164 Views
Internal assessment, Results, Discussion, and Format. By Mr Daniel Hansson. Sections of internal assessment. Title page Abstract Table of contents Introduction Method Results Discussion References Appendices. Title page.

E N D
Internal assessment, Results, Discussion, and Format By Mr Daniel Hansson
Sections of internal assessment • Title page • Abstract • Table of contents • Introduction • Method • Results • Discussion • References • Appendices
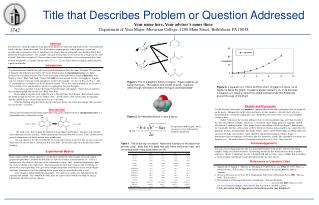
Title page • The hypothesis/aim may determine how the title is constructed. You are also allowed to be creative • Candidate number, date of completion, the instructor´s name, the level of course (HL or SL) and the final word count should be clearly indicated on the title page (1,500 for SL and 2,000 for HL)
Abstract • The abstract contains a summary of important information about the study. It should summarize aim, method, results, and conclusion of the study. It should not exceed 200 words.
Table of contents • All pages should be numbered, including the appendices
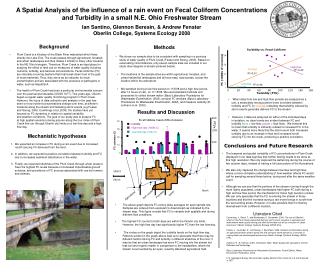
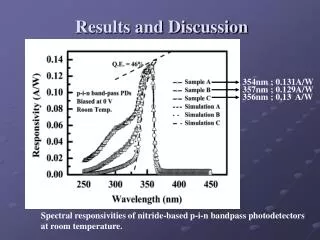
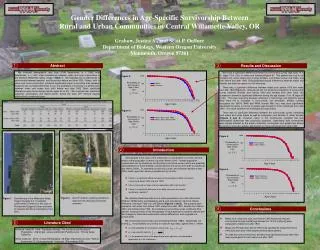
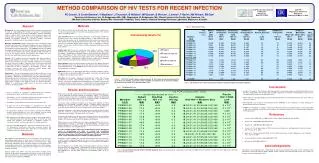
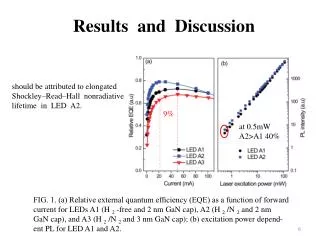
Results (SL) • 1 graph, 1 table • Graph should show averages of conditions/groups and not individual scores!!! • A narrative statement of results. State differences in range and differences in averages • Ordinal data • One measure of central tendency (mean,median, or mode) • One measure of dispersion (Range or standard deviation) • Justification for choice of the descriptive statistic
Results (HL) • 1 graph, 1 table • Graph should show averages of conditions/groups and not individual scores!!! • Narrative statement of results • Ordinal data • Only use data that is relevant to your hypotheses • One measure of central tendency (Mean, median, mode) • One measure of dispersion (range, standard deviation) • Justification of the use of the measures • Statistical test (Mann-WhitneyU or Wilcoxon T) • Justification of the statistical test chosen • Acceptance or rejection of null hypothesis • A statement of the statistical significance
Justification for measure of central tendency • Mean: If sample is expected to be representative of target population, if data is ratio or interval. Most of you will use mean • Median: If there are extreme outliers, if data is ordinal
Justification for measure of dispersion • Range: If data is ordinal and sample size is large • Standard deviation: Most of you will do a standard deviation. If data is ratio/interval and the population is assumed to be normally distributed
Justification for use of statistical test • Mann Whitney U: If your hypothesis predicts a difference between two sets of data. If the sets of data are from separate groups of participants. If the data are ordinal or interval. • Wilcoxon matched pairs signed ranks test (T): If the hypothesispredicts a difference between two sets of data. If the two sets of data are related, i.e. pairs of scores from one person. If the data is ordinal or interval.
Significance • Significance: In statistics, the probability of how likely a result have occurred by chance
An example of the statement of the statistical significance • To test the significance of results, a Mann Whitney U test was used the experimental design was independent measures and no assumption of the population distribution was required. The test was one-tailed because the experimental hypothesis predicted a direction of the results. The number of participants was 10 and the critical value at a 5 % significance level is 3. As the observed value was 0, the results are significant. The probability of getting these results by chance are less than 5 %. This means that the null hypothesis is rejected and the research hypothesis is accepted.
Discussion (SL) • Linking of results to study being replicated • Explanation/discussion of results, e.g. Differences between central tendency and measures of dispersion • Weaknesses of methodology • Suggestions for modification of study to adress weaknesses • A final brief conclusion which summarizes the results of the experiment
Discussion (HL) • Linking of results to research mentioned in introduction • Explanation/discussion of results (descriptive and inferential statistics) • Limitations of methodology • Suggestions for modification of study to adress weaknesses • A final brief conclusion which summarizes the results of the experiment
References • SL: At least one reference • HL: At least three references • A complete set of references • Sources must be credible, preferably primary • Correct APA format
Appendix • Raw data • Calculations • Blank consent form • Blank debriefing note • Instructions • Any other written material used