Download
1 / 69
1.03k likes | 1.72k Views
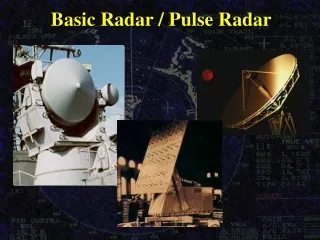
Radar Basics. How does radar work? What are the characteristics of all radar systems? What are the characteristics of Canadian radars? Introduction to the basic radar systems. Conventional Doppler Dual Polarized. RADAR BEAM. The beam of energy spreads out with distance,

E N D
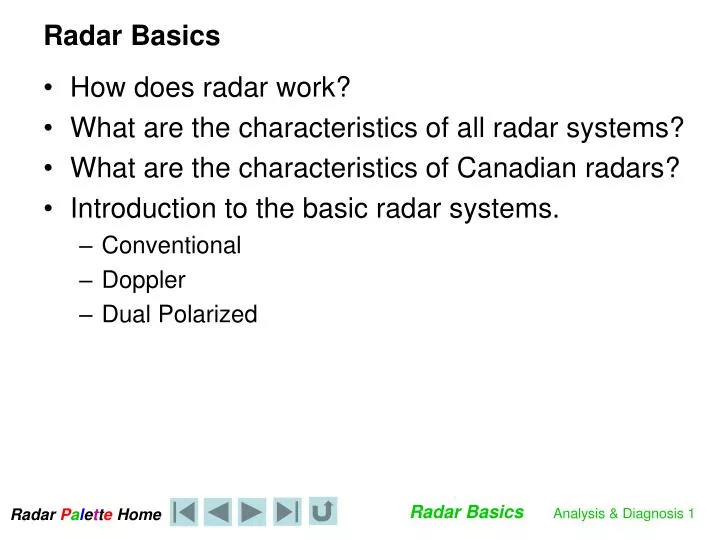
Radar Basics • How does radar work? • What are the characteristics of all radar systems? • What are the characteristics of Canadian radars? • Introduction to the basic radar systems. • Conventional • Doppler • Dual Polarized
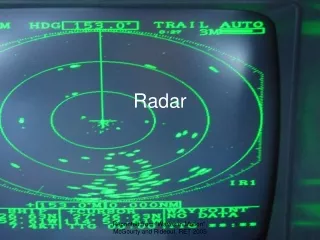
RADAR BEAM The beam of energy spreads out with distance, taking a shape resembling a cone just like the light beam from a coastal lighthouse.
First pulse Second pulse beam axis t h (pulselength in space) (pulselength in time) beam width
200 150 100 50 r Widening Beam Beamwidth (Wb) at a range (r) is given by: Wb = r ·sin q For small angles it can be approximated as Wb» r q
EM Wave Propagation Vacuum : approximately 3 * 108 m/s in a homogeneous medium - straight line - constant speed atmosphere not being homogeneous...
Atmospheric Interactions Refraction – beam bending Absorption – energy absorption Scattering – beam scattering Reflection – beam reflection
Refraction refractive index n = c / u n: refractive index c: lightspeed (in vacuum) u: lightspeed in medium Refractivity (N) N = (n-1) 106
Radar Propagation depends mainly on vertical refractivity gradient assumed straight line propagation under “normal” conditions: - constant standard refractive index gradient - constant radius of the earth
Radar Equation Pr : average received power (W) Pt : peak transmitted power (W) ke: pulse length in space (m) G : antenna gain qb : horizontal beam width fb : vertical beam width l : transmitted wavelength (m) |K|2: target’s refractive index r : target’s slant range (m) Z : target reflectivity factor or Ze (mm6m-3)
Assumptions • Radar range Equation • non uniform vertical distribution • Z-R variations • beam filling
Simpler Radar Equation Pr average received power where C is the Radar Constant K target’s refractive index Z target reflectivity factor r target’s slant range
Sampling Reflectivity Dimensions of volume elements being scanned are determined by the beam widths and pulse length. Beam width is associated with the equipment: Pulse length affects the size of conical section being sensed.
ATMOSPHERIC ATTENUATION As radiation interacts with encountered particles within a swept portion of the atmosphere, the associated energy undergoes several changes which tends to further reduce its flux along the pulsating beams. This is mainly due to: • absorption • scattering
ATMOSPHERIC ABSORPTION For microwaves, main absorbing gases are: Water vapor : Oxygen : • pressure • temperature (inverse) • absolute humidity • pressure (squared) • temperature weaker variables: - climate - season Corrections to the order of 3 to 4 dB (within 200 km) can be applied to precipitation measurements.
Attenuation PRF can theoretically determine a maximum unambiguous range. In practice, within a network, the useful range of weather radars would be less than 200 km. Quantitative precipitation measurements near the surface can extend to a distance of 130 km. Doppler may expand intrinsic limitations with new developments. Special requirements for long range detection of thunderstorm can also be serviced.
Hydrometeors attenuation relates to: - shape - size - composition - wavelength: • 10 cm: rather weak • 5 cm: acceptable (higher latitude) • 3 cm: significant
Water mass larger water mass causes more attenuation: ice has less effect than liquid. Attenuation increases in: - more dense precipitation areas - heavier precipitation
Size Melting precipitation and larger particles such as - wet snow - hail can distort precipitation estimates. Cloud particles have little effect; it can be ignored (unless more precision required)
abnormal atmospheric conditions subrefraction superrefraction ducting cool, moist air aloft warm, dry air below Unstable? warm dry air aloft cool, moist air below Stable! Really Stable!
B Warm Frontal Cross-section along Leading Branch of the Warm Conveyor Belt (WCB) Common location for virga A WCB WCB oriented for maximum frontal lift Virga Precipitation Increasing CCB Moistening WCB oriented for less frontal lift Lower Hydrometeor Density Mixing Zone Surface Warm Front CCB Link to Classic Example B A Cold air in Cold Conveyor Belt (CCB) deep and dry Moist portion of Warm Conveyor Belt (WCB) is high and veered from frontal perpendicular – katabatic tendency Dry lower levels of WCB originate from ahead of the system and backed from frontal perpendicular WCB typically veers with height (it is after all, a warm front) Frontal slope is more shallow than the typical 1:200 Precipitation extends equidistant into the unmodified CCB Precipitation extends further into the moistened, modified CCB
C C C WCB DCB CCB DCB Vertical Deformation Zone Distribution and the CBMSimplified Summary The WCB overrides the warm front The CCB undercuts the warm front The frontal surface overlies the mixing layer Wind shear in the CCB is variable • Looking along the flow: • In WCB to the right of the Col expect veering winds with height – Katabatic warm front • In WCB approach to the right of the Col expect maximum divergence – the eagle pattern with ascent and increasing pcpn • In WCB to the left of the Col expect backing winds with height – Anabatic warm front
Need to emphasize The PPI nature of the Doppler scan - The cone D A G C B E F H
D A G C B E F H
Under WCB • Virga only likely on the leading edge of the WCB • The CCB is becoming increasingly moist • Frontal overrunning and isentropic lift is increasing thus increasing the intensity of the precipitation process. • Warm front becoming more likely Anabatic Click for the Conceptual Model and Explanation
B Warm Frontal Cross-section along Central Branch of the Warm Conveyor Belt (WCB) A Common location for virga WCB WCB oriented for maximum frontal lift Virga Precipitation Increasing CCB Moistening Lower Hydrometeor Density Mixing Zone Precipitation At Surface Surface Warm Front CCB B A Cold air in Cold Conveyor Belt (CCB) more shallow and moist Moist portion of Warm Conveyor Belt (WCB) is thicker, higher and perpendicularto front Lower levels of WCB have the same origin as the upper level of the WCB - frontal perpendicular WCB shows little directional shift with height. A greater WCB depth is frontal perpendicular Frontal slope is near the typical 1:200 Precipitation extends further into the moistened, modified CCB. Horizontal rain area begins to expand as CCB moistens.