Download
1 / 25
310 likes | 693 Views
Basic Radar / Pulse Radar. Objectives. Explain how range is determined with the basic radar system. Apply relationships between Duty Cycle, PW, PRF, PRT, average and peak power . Calculate Signal to Noise ratio (dB and dimensionless).

E N D
Objectives • Explain how range is determined with the basic radar system. • Apply relationships between Duty Cycle, PW, PRF, PRT, average and peak power. • Calculate Signal to Noise ratio (dB and dimensionless). • Apply the relationship between S/N, NEP and Minimum Signal for Detection. • Explain Threshold Level (TL) and distinguish setting the receiver above and below the minimum signal for detection. • Identify the components of the Basic Pulsed Radar system
Introduction • Heinrich Hertz – German Physicist proved in late 1880’s that electromagnetic waves were generated by ‘sparks’ from an oscillator. Then noted “It’s of no use, what so ever”. • Guglielmo Marconi – Italian Electrical Engineer. In 1895, sent EM signal to a point several kilometers away. 1899 sends communication between Britain and France. 1909 wins Nobel Prize in Physics.
Radar At War • World War I was a war fought with eyes and ears – no such thing as RADAR. • Pre-WWII, Germany had numerous Funkmessgeraets, or ‘radio measuring devices’. Numbers outpaced the allies along with sophistication. • By late 1940, Germany ceased development of radar systems, predicting a short war. • British and US research and development caught up to and exceeded Germans. • Chain Home used 30 MHz range. Freya
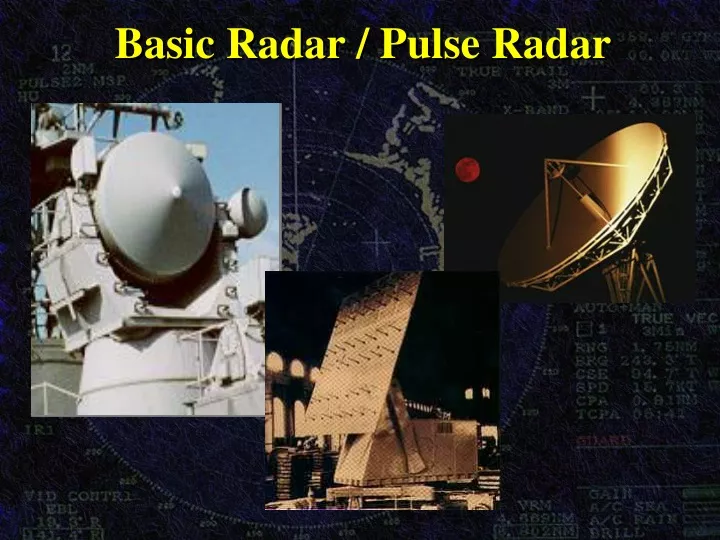
Pulsed Radar • Extend the environment beyond our own eyes and ears. Extends detection capability. • Advantages • Can see through conditions that impair visual detection, with a longer visual LOS range. • Gives an accurate measurement of range and relative motion (more so than with just eyes). • Gives accurate measurement of azimuth and elevation. • Accurate information fed into fire control systems much more efficiently than human capable of doing. • Disadvantages • Poor target resolution. • Poor ID capability.
Radio Frequency(RF) • The working/operating frequency • Modulated to form pulse train • Ranges between 400MHz and 20 GHz • Most commonly radars use • 1000 MHz – 17GHz
Pulse Diagram PRF = 1/PRT
Pulse Repetition Time (PRT) • PRT has units of time (milliseconds). • Is interval between start of one pulse and start of another. Total time for one transmission (send/receive). • PRT = PW + RT = one pulse / # pulses per second • Also known as Pulse Repetition Interval (PRI).
Peak Power /Average Power • Peak Power (PPK) • Power in each pulse. • Affects maximum radar range. • Usually expressed in kilowatts or megawatts. • Average Power (PAVG) • Power in each pulse spread over entire PRT. • Higher average power requires greater heat removal. • Usually expressed in kilowatts. • Duty Cycle • Convenient way to express loading on transmitter. Duty Cycle = (PW) (PRF) = PW/PRT = PAVE/PPEAK
Example 1 A 50 MHz RADAR has a PRF of 5,000 Hz, Average power of 20 kW and a pulse width of 2 μSec. Calculate the peak power of this radar. Duty Cycle = (PW) (PRF) = PW/PRT = PAVE/PPEAK (2x10⁻⁶sec)(5000 Hz) =( 20x103W)/PPeak Ppeak = 2000kW
Pulsed Radars • Most widely used technique, the ‘conventional’ radar. • Based on electromagnetic pulse that is sent out into the environment and waited on for ‘echo’. • Utilizes speed of light to measure range of echo. R = ct / 2
Range Calculations • Range = c Dt 2 • Example: If you have a radar signal that is transmitted and returned from a contact in 33 msecs, what is the range to the contact ? • R = 3X10⁸ m/s X 33X10-6 s = 9873 m = 4.93 km • 2 2
Pulse Radar Components Coordinator of entire operation. Tells each component when to do their thing The RF oscillator that generates and|amplifies the signal. Acts as gate for transmitted and received signals. Prevents receiver from being blasted Supplies AC & DC power for radar operation Antenna – radiates and receives the signal. Display section, or scope. Let’s you see the radar scope. Receives, amplifies and processes the return signal,
Radar Demo • Basic Pulse Radar • 1 plane • Long and short pulse
Signal Reception • Only a minute portion of the RF is reflected off the target. • Only a fraction of that returns to the antenna. • The weaker the signal the receiver can process, the greater the effective range.
Signal-to-Noise Ratio • Ability to recognize target in background noise. • Noise is always present. • At some range, noise is greater than target’s return. • Noise sets the absolute lower limit of the receiver’s sensitivity. The average amount of background noise is called Noise Equivalent Power (NEP). • Threshold level used to suppresses excess noise. • S/N sets a threshold for detection that determines what will be displayed and what will not. • If S/N = 1 then only returns with power equal to or greater than the background noise will be displayed.
Noise Equivalent Power (NEP) • Noise is always present. • internal & external / natural & intentional • pulses returning from long range can be less than ambient noise level • Noise sets absolute lower limit of radar receiver’s sensitivity. • The average amount of background noise is called Noise Equivalent Power (NEP). • NEP relates noise to a detected power level so that it may be compared to the returning radar signal. • NEP usually expressed in Watts.
Targets False Alarms TL #1 Mean Noise level time Noise Spikes Threshold Level
Targets False Targets PPI
Targets False Alarms TL #1 TL #2 Mean Noise level time Noise Spikes Threshold Level
Undetected Target Targets Targets PPI
1000 Hz signal level is 15 dBm Level of noise is 5 dBm SNR is 10 dB Signal to Noise Ratio Review • Signal to Noise quantifies the background noise intensity compared to the total signal intensity • S/Nis the signal to noise quotient S/N = 10 (SNR/10) • SNR is S/N expressed in decibels (dB) SNR = 10 log (S/N) • (SNR)dB = levelsignal(dBm) - levelnoise(dBm)
Smin • Smin = Minimum Signal for Detection • Measure of the strength of the weakest signal return received by the radar and evaluated as a valid contact • To get a valid contact, Return Power (Pr) needs to be greater than Smin therefore… (Pr) > (S/N) (NEP) = Smin
MDS • MDS = Minimum Discernable Signal • Decibel equivalent of Smin • Calculated relative to 1 mW
Objectives • Explain how range is determined with the basic radar system. • Apply relationships between Duty Cycle, PW, PRF, PRT, average and peak power. • Calculate Signal to Noise ratio (dB and dimensionless). • Apply the relationship between S/N, NEP and Minimum Signal for Detection. • Explain Threshold Level (TL) and distinguish setting the receiver above and below the minimum signal for detection. • Identify the components of the Basic Pulsed Radar system