Download
1 / 9
100 likes | 185 Views
Comparison of Two Means. Paul Niezguski Peter Heisler University of Michigan College of Engineering. Professor X is curious if there is statistical difference between the test grades of his morning and afternoon chemistry classes. Statistical data for the two classes:

E N D
Comparison of Two Means Paul Niezguski Peter Heisler University of Michigan College of Engineering
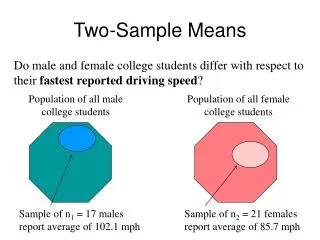
Professor X is curious if there is statistical difference between the test grades of his morning and afternoon chemistry classes
Statistical data for the two classes: Morning class: Afternoon class: mean: 78.5 mean: 84.2 std. dev: 11.3 std. dev: 11.0 sample size: 24 sample size: 27
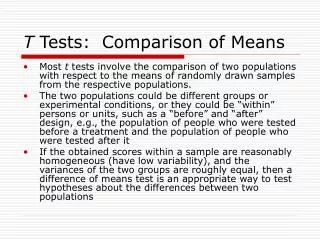
He hypothesizes that afternoon students will be more alert in class and thus have higher test scores. The class test means support this, but to what certainty can Professor X make this assertion?
He finds a wiki article on comparison of means by using the Student’s t test. This method uses the following equations: For two sets with similar standard deviations: x1= mean from data set 1 x2= mean from data set 2 n1= number of measurements set 1 n2= number of measurements set 2 s1 = std. deviation of set 1 s2 = std. deviation of set 2
After a careful mental calculation by professor X, he determines the following t value: t = 1.820741
He then consults the following t table to determine at what confidence level the means are statistically different:
The table gives a confidence level of 90 – 95% that the two means are statistically different…thus Professor X’s hypothesis is most likely correct. He is so pleased he decides to go hunting.