Download

1 / 34
340 likes | 462 Views
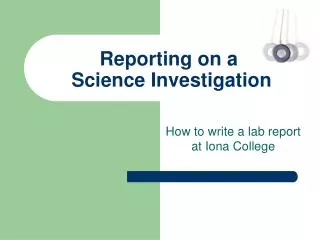
Oregon 4-H Science Rich Inquiry Activity. Focus on the 4-H Science Investigation Display. Virginia Bourdeau, Professor virginia.bourdeau@oregonstate.edu.

E N D
Oregon 4-H Science Rich Inquiry Activity Focus on the 4-H Science Investigation Display Virginia Bourdeau, Professor virginia.bourdeau@oregonstate.edu
Please go to the link below to print the Science Investigation Display Evaluation sheet. This should be used by the leader and youth to assure the display meets the criteria of the exhibit class. http://oregon.4h.oregonstate.edu/contest-materials-science-engineering-technology Link to Science Investigation Display
Open to all 4-H members regardless of project enrollment. • Display Description: The purpose of this type of exhibit is for members to communicate the processes and outcomes of a scientific investigation they design and conduct themselves. The display must include: (1) a question or hypothesis, (2) an investigative procedure (What was done?), (3) the data collection or observation method (How was it collected/ observed), (4) a report of the data collected or observations made, ….requirements continue on next slide> Science Investigation Display
Display Description continued: (5) an analysis of the data collected or observations made (How do you interpret the data and evidence?), (6) a conclusion addressing the original question or hypothesis (Does the evidence support or refute your claim?). NOTE: Intermediate and Senior Exhibits must include a data chart and a graph or other visual representation of the data. Science Investigation Display
The exhibit may be a poster or a three-dimensional display. Individual three-dimensional exhibits are limited in size to 48” wide (measured when lying flat), 24” deep (front to back), and 36” high. • Club exhibits are limited in size to 60” wide, 24” deep and 36” high. Posters are limited in size to 30” by 24”. Science Investigation Display
Exhibits may include pictures, models, diagrams and actual articles if they meet the safety standards listed below. Drawings or photos which are an essential part of the display should be firmly attached to the board. Loose materials like soil, bark or sand must be displayed in closed containers. No books or notebooks will be accepted as part of the display. The following materials will not be allowed on the display for safety reasons: • Living organisms- plants or animals • Any liquids • Aerosol bottles or other pressurized gases • Glass • Hazardous substances • Sharp items Science Investigation Display
Display (all parts) should be able to last the duration of the fair in good repair. • An Educational Display Exhibit Card (000-01) must be attached to each exhibit. • Judging criteria are outlined on the 4-H Science Investigation Display Evaluation Sheet (840-100). • Both are available from the county Extension Office or the state 4-H website at http://oregon.4h.oregonstate.edu/fair-exhitit-and-contest-materials Science Investigation Display
Each piece of an exhibit must have name, county and class numbers securely attached to it. All parts of the display should be attached to one another in some way to keep the exhibit together as a unit. Single posters may be displayed by hanging or stapling to the wall. All other displays should be free standing. All information contained in the exhibit must be able to be viewed by the public by looking at the display. • 840 100 001 Junior Science Investigation Display • 840 100 002 Intermediate Science Investigation Display • 840 100 003 Senior Science Investigation Display • 840 100 004 Club Science Investigation Display Science Investigation Display
When youth are conducting their investigations be sure they write out the items which will be needed to complete their display, which include : • A question or hypothesis • An investigative procedure • A description of the data collection or observation method • A report on the data collected or observations made • An analysis of the data collected or observations made. (a) Intermediate and Senior displays must include a data chart & a graph or other visual representation of data. • A conclusion addressing the original question or hypothesis. Tips for creating a Science Investigation Display
Tips for creating a Science Investigation Display. See http://oregon.4h.oregonstate.edu/communications-projects for videos on making displays. Remember, the evaluation sheet for the Science Investigation Display is unique to that class and not the same as the regular Educational Displays class.
Collect the materials and supplies you need to create a display: • A computer and printer • A word processor program or PowerPoint. Use of PowerPoint to produce the text, graphs and pictures on the display is strongly recommended. • Display board- refer to the current year’s fair book for allowable display board sizes for individual and team displays. • A clean work surface. • Ruler, scissors or Exacto knife, colored paper, craft foam, and other items to provide a creative and engaging display. Tips for creating a Science Investigation Display
Plan the lay out of your whole poster before you begin to print content. Mounting text and images on custom sized pieces of colored poster board and placing them on the main display board is easier than working with the whole board at one time.
In this example the text and pictures were printed on yellow paper and mounted on green poster board before being mounted onto the main display board.
Use rulers to assure that your text and illustrations are mounted straight.When mounting the colored poster board to the display board repeat this process.
Question: Does ocean water evaporate faster than fresh water in the same conditions?
When printing your text, think about how it will look best. The top example is left justified. The bottom example is centered.Use a large enough type size that your poster can be read from no less than 3 feet away.
My Investigative Procedure • I used 2 plastic cups each holding 8 ounces of water at room temperature. • I used 2 thermometer to be sure the temperature of the water in both cups was the same when I began on day 1 and day 2. • I covered both cups with black paper. • I added 2 teaspoons of table salt to cup B. • I put both cups outside in a sunny location from 8:00 AM to 6:00 PM for 2 days.
My data collection method • I checked the temperature of the water in both cups every hour, from 8:00 AM to 6:00PM, for 2 days and recoded the temperature readings. • I measured the volume of water in both cups at 6:00PM each day. Cut this slide off here -- --- --- --- --- Do not include a large area of blank paper.
Be sure to indicate on your chart what your units of measurement are. The chart on the next slide states that the temperatures are reported in degrees Fahrenheit.
Data Collection Report Temperatures are reported in degrees Fahrenheit.
The following slides will show you how to use PowerPoint to create Line and Column graphs to print for your display. Intermediate’s and Senior’s Exhibits must include a data graph or other visual representation of the data collected.
The next slides will show you how to create a line graph with PowerPoint.
Enter your data on the Excel sheet on the right. It will appear on the graph in the window below. You can right click on the Series 3 column to add or delete columns from the chart
You may need to open the Format Axis dialog box by clicking on the graph’s left axis to format the axis for your data set.
The next two slides are column graphs made in PowerPoint. Compare the two graphs. Graph #1 shows the data for cup A and B. The daily evaporation is shown by the bars. Graph #2 reports the date for each day with cup A and B shown side by side. On which graph is it easier to tell that the evaporation was the same in both cup A and cup B on both days? Remember to not only select the correct type of graph to display your data, but also how it should be displayed on the graph to best communicate what you wish to show.
Graph #2 clearly shows that evaporation was the same in both cup A and B on Day 1 and 2. In this investigation, there was no difference shown between the evaporation rate of salt water and fresh water.
Mount your data report close to your graph so people reading it can easily compare them.
My Data Analysis The starting temperature of the salt water and fresh water was the same on both Day 1 and Day 2. The salt water reached a higher temperature on both days than the fresh water. Both days were slightly overcast in the afternoon. I observed there were some salt crystals on the edge of cup B above the water line. The volume of water that evaporated from the salt water was exactly the same as the volume of fresh water that evaporated both days.
My Conclusion In this experiment ocean (salt) water did NOT evaporate faster than fresh water in the same conditions. I plan to try this experiment again. Next time I will record the air temperature each hour when I record water temperature. I will wait until there are at least two consecutive fully sunny days forecast. I will extend the time of data collection to four days.
4-H Science Investigation displays are a great way to show what you learn in many 4-H project areas.