Download
1 / 9
90 likes | 96 Views
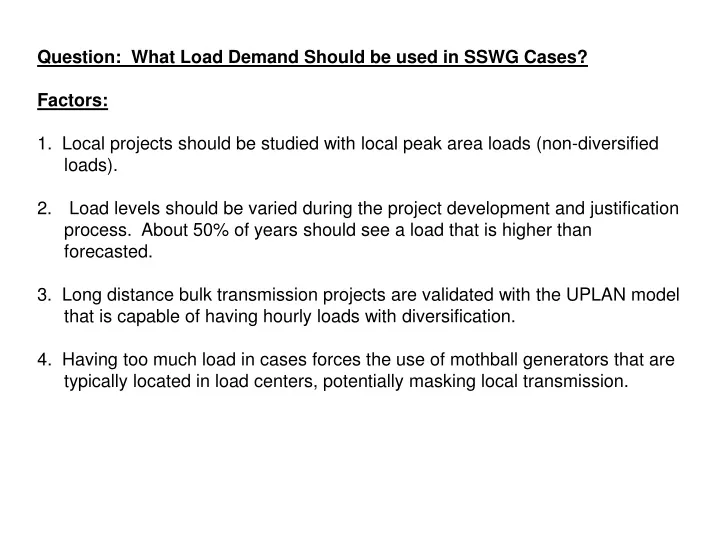
Question: What Load Demand Should be used in SSWG Cases? Factors: 1. Local projects should be studied with local peak area loads (non-diversified loads).

E N D
Question: What Load Demand Should be used in SSWG Cases? • Factors: • 1. Local projects should be studied with local peak area loads (non-diversified loads). • Load levels should be varied during the project development and justification process. About 50% of years should see a load that is higher than forecasted. • 3. Long distance bulk transmission projects are validated with the UPLAN model that is capable of having hourly loads with diversification. • 4. Having too much load in cases forces the use of mothball generators that are typically located in load centers, potentially masking local transmission.
Question: What is ERCOT’s current peak demand forecast? From ERCOT’s October 1 Report (Report on Existing and Potential Electric System Constraints and Needs (p.10)) Peak Demand Texas has experienced significant economic growth over the past several years. As a result the demand for electricity has also increased. From 1999 to 2005 the peak demand on the ERCOT system has increased approximately 1.6% per year. The current forecast for 2006 to 2011 indicates ERCOT’s peak demand is expected to continue this trend with an increase of 1.6% annually, as shown below.
Question: How does the ERCOT peak demand forecast compare to the SSWG Cases? • Components that may explain forecasted demand cap. • Case loads are diversified at the Transmission Owner level and not at the ERCOT level. • Cases should be studied with higher than forecasted load since forecasts are imperfect and actual loads may be higher than forecasted. • Note: SSWG case loads have Self-serve loads backed out
Question: What is the diversified load impact? To best replicate the way that SSWG cases are built, an analysis was done with the 1998 – 2000 actual load data that is shown by the old ERCOT Control Areas.
Question: How should load diversification be handled for SSWG Cases? Look at the demand share of each Transmission Owner as a percent of the ERCOT non-coincident peak load. Look at the demand share of each Transmission Owner as a percent of the ERCOT non-coincident peak load. To be conservative, take the maximum share of the three years. Suggestion: It is likely that the high-end of load error that can be attributed to load diversification is about 2%
Question: How should forecast error be handled for SSWG Cases? Based on the ERCOT’s October 1 report indicating that peak demand growth from 1995 to 2005 was approximately 1.6% per year, and this same rate of growth is expected for the years 2006 – 2011, the implied forecast versus actual demand is shown below. The data shows that 5 of 7 years the actual demand was below forecast. The largest “under forecast” was 2.5% was in 2000. Suggestion: Based on the highest error in 7 years, plan system for 2.5% higher demand than forecast.
Question: How much demand gap is explained with these two factors? If the suggested adders from the previous two discussions were adopted, the demand modeled in a case would be represented as: ERCOT Peak Demand x (1 + 2.0%) x (1 + 2.5%) Added for forecast error Adder for diversification 2006 Forecasted Peak Demand: 62,212 MW x 1.020 x 1.025 = 65,043
Question: How does this method compare with current SSWG cases?
Question: What about high growth areas? • From ERCOT’s October 1 Report (Report on Existing and Potential Electric System Constraints and Needs (p.11)) • While ERCOT’s overall peak demand forecast calls for a 1.6% annual growth rate, some areas within the state are experiencing growth as high as 6% per year. As expected, the greatest growth is in the metropolitan areas. • The counties with the greatest expected cumulative load growth are Harris, Dallas, Tarrant, and Bexar. Other areas expected to experience significant load growth include the Austin metro area and the lower Rio Grande border. • ERCOT describes the high growth areas on page 11 of the report, however, even after the high growth areas are accounted for, the aggregated system demand growth is still 1.6% annually.