Download
1 / 20
210 likes | 370 Views
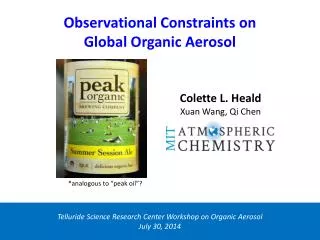
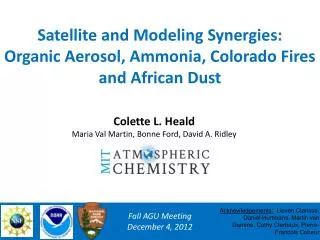
A Top-Down Perspective on Organic Aerosol: From Satellite to Surface. Colette L. Heald Kateryna Lapina and Bonne Ford. AMS 92nd Annual Meeting January 23, 2012. ORGANIC AEROSOL MAKES UP AN IMPORTANT/DOMINANT FRACTION OF OBSERVED AEROSOL. Sulfate Organics. [Zhang et al., 2007].

E N D
A Top-Down Perspective on Organic Aerosol: From Satellite to Surface Colette L. Heald Kateryna Lapina and Bonne Ford AMS 92nd Annual Meeting January 23, 2012
ORGANIC AEROSOL MAKES UP AN IMPORTANT/DOMINANT FRACTION OF OBSERVED AEROSOL Sulfate Organics [Zhang et al., 2007] Globally makes up 25-75% of total fine aerosol at the surface (ignoring dust here)
MODELS UNDERESTIMATE OBSERVED OA Obs (Maria et al., 2003) GEOS-Chem ACE-Asia (2001): 3 groups measured high OA off Asia. GEOS-Chem simulation factor of 10-100 too low [Heald et al., 2005] “Anthropogenic” air masses show more aerosol growth than can be explained by the oxidation of aromatics. [de Gouw et al., 2005] Models drastically underestimate SOA from 4 campaigns [Volkamer et al., 2006] Models (from box models to global models) were found to underestimate observed concentrations in the ambient atmosphere.
HOW LARGE A MISSING SOURCE OF ORGANIC AEROSOL? Goldstein and Galbally [2007] suggest that SOA source may be anywhere from 140-910 TgC/yr. For comparison, current global model (GEOS-Chem) estimates total ~50 TgC/yr Can total aerosol optical depth (AOD) measurements shed any light on the total budget of OA?
IF ONLY AEROSOL IN THE ATMOSPHERE WAS OA, WHAT LOADING IS IMPLIED BY SATELLITE AOD? Calculate the “hypothetical” AOD implied by a constant 1 g/sm3 profile over the land, and see how we need to scale this locally to make up ENTIRE AOD reported by MISR. Inverted total MISR AOD: Surface OA concentrations Inverted OA loading is 3.5 TgC over land. Assume a 6 days lifetime = 215 TgC/yr extrapolate to include outflow ~430 TgC/yr. (middle of Goldstein & Galbally range)
A MORE REALISTIC POSSIBILITY:REMOVE CONTRIBUTIONS FROM DUST, BC, INORGANICS(assuming all the negative bias in the model is ONLY OA) DJF JJA If remove N. Africa & the Middle (dust), estimate that ~150 TgC/yr source is required to close the MISR-GEOS-Chem* discrepancy. (*Made an assumption about the vertical profile of OA*) MISR GEOS-Chem* MISR- GEOS-Chem* *excluding OA
HAVE WE REDUCED THE UNCERTAINTY ON THE OA BUDGET? All units in TgCyr-1 910 This is more than THREE TIMES what is currently included in global models…. BUT at the low end of Goldstein & Gallbally [2007] range. Also in relatively good agreement with Spracklen et al. [2011] estimate. Our satellite top-down estimate 140 150 82 SOA (optimized) Existing GEOS-Chem sources 47 24 POA (fixed) Bottom-up estimate [Goldstein and Galbally, 2007] AMS surface-based optimization [Spracklen et al., 2011] Satellite-based estimate [Heald et al., 2010]
MARINE ORGANIC AEROSOL WIND Sea-spray emission Surfactant Layer (with Organics) Ocean SPRING (high biological activity) SeaWIFS Under biologically active conditions, OA has been observed to dominate sub-micron aerosol mass. [O’Dowd et al., 2004]
IS THE OCEAN AN IMPORTANT SOURCE OF OA? Previous estimates range from 2.3 to 75 TgC/yr No marine OA With marine OA OA Emissions Observations from 5 ship cruises show that marine OA from 2 schemes (based on MODIS / SeaWIFSchlorphyll-a) of ~9 TgC/yr are more than sufficient to reproduce sub-micron OA. [Lapina et al., 2011] Measurements from: J.D. Allan, H. Coe, G. McFiggans, S.R. Zorn, F. Drewnick, T.S. Bates, L.N. Hawkins, L.M. Russell
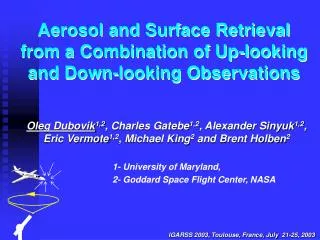
DIGGING IN DEEPER: 17 AIRCRAFT FIELD CAMPAIGNS 2001-2009 * All AMS measurements, except ITCT-2K4 (PILS) and ACE-Asia (filters). Aircraft constraints on the organic aerosol distribution through depth of troposphere in remote, polluted and fire influenced regions. GOAL: investigate vertical profile and compare with one CONSISTENT model. GEOS-Chem SOA simulation: 2 product model, monoterpenes/sesquiterpenes +OH/O3/NO3 (Griffin et al, 1999), low-NOx isoprene+OH (Kroll et al., 2006), NOx dependent aromatics +OH(Ng et al., 2007) latest description Henze et al., 2008 Measurements PIs: Hugh Coe (ITOP, ADRIEX, DABEX, DODO, AMMA, ADIENT, EUCAARI, OP3, VOCALS-UK, TROMPEX), Jose Jimenez, (MILAGRO, IMPEX, ARCTAS), Rodney Weber (ITCT-2K4), Ann Middlebrook (TexAQS), Lynn Russell (ACE-Asia)
OVERALL COMPARISON OF OA SIMULATION(an “update” to Volkamer et al., 2006) Range = 0.45-4.5 Median model underestimate of aircraft observations less than a factor of 5. Key difference from Volkamer et al [2006]: Discrepancy is largest close to source.
CAN WE ATTRIBUTE THE MODEL UNDERESTIMATE? Adding ~100 Tg/yr source of ASOA (as suggested by Spracklen et al., 2011) improves comparison in polluted regions, but leads to too much OA aloft and in remote regions. Higher volatility OA? OA sink?
FRAGMENTATION LOSS OF ORGANICS [Molina et al., 2004; Kwan et al., 2006; Kroll et al., 2007; Chan et al., 2007; Kroll et al., 2009] + Oxidation By OH 5% 95% Functionalization Fragmentation (break C-C bonds) OH Decrease volatility Increase volatility • Simple sensitivity tests in GEOS-Chem: • assuming that 5% of reacted organics are fragmented (LOSS) • assume that 95% are functionalized (NO CHANGE) • Testing 2 types of fragmentation loss: • Oxidation of gas-phase organics (faster, kOH=2x10-11 cm3/molecules/s) • Heterogeneous oxidation of SOA (slower, kOH=1x10-12 cm3/molecules/s)
IMPACT OF FRAGMENTATION ON SIMULATED SOA BUDGET (GEOS-Chem: 2008 simulation) GAS PARTICLE -47% -15% Gas-Phase Fragmentation Heterogeneous Fragmentation = slow leak Gas-Phase: -47% (likely upper limit) Heterogeneous: -15% Fragmentation of gas-phase organics efficiently “prevents” SOA formation. Is most efficient for more volatile organics. Fragmentation from heterogeneous oxidation is much slower but is still a potentially important sink of SOA.
IMPACT OF FRAGMENTATION SINK & CHANGING VOLATILITY ON COMPARISONS WITH FIELD DATA ASOAx30 +heterogeneous fragmentation sink ASOAx30 +gas-phase fragmentation sink ASOAx30 + H=25 kJ/mol (increase volatility) ASOAx30 ~equivalent Effect of gas-phase fragmentation sink is comparable to increasing volatility away from source (via enthalpy of vaporization). Adding ~100 Tg/yr of ASOA and a gas fragmentation sink brings model simulation to within1 g/m3of observed concentrations in 15 of 17 campaigns. Model may need SOURCES and SINKS. [Heald et al., 2011]
IS AEROSOL CONTRIBUTING TO CLIMATE TRENDS IN SOUTHEASTERN US? Summertime trends 1950-2006 Data: Global Historical Climate Network Daily (GHCND) “Although clearly speculative, increasing biogenic secondary organic aerosol/cloud effects linked to forest regrowth and/or interactions with anthropogenic pollution is one possibility that is qualitatively consistent, not only with the spatial structure, but also with the seasonality of the correlation of the unusual negative temperature trends with precipitation found in the southeastern United States.” [Portmann et al., 2009]
SEASONAL AEROSOL MAXIMUM IN THE SOUTHEASTERN US Summer-Winter AOD (MISR) Annual Mean AOD (MISR) Summer-Winter AOD (MODIS) AOD at Walker Branch MODIS MISR Seasonal maximum in AOD consistent with biogenic emissions (implication: biogenic SOA) [Goldstein et al., 2009]
IS THIS CONSISTENT WITH OUR UNDERSTANDING OF AEROSOL IN THE REGION? Spring (MAM) Summer (JJA) NO! Model does not reproduce the Southeastern maximum.
BUT, IT’S ALSO INCONSISTENT WITH SURFACE DATA Observed Seasonality of Surface PM Preliminary Comparison of Vertical Profile in the SE US [Malm et al., 2003] Surface data does not indicate that organic aerosol dominates at surface. Also see stronger seasonal cycle in Northeast. Possibly aerosol aloft? Bonne Ford (CSU)
Acknowledgments: Satellite OA: David Ridley, Easan Drury, Sonia Kreidenweis Marine OA: Dominick Spracklen, Steve Arnold, James Allan, Hugh Coe and Gordon McFiggans, Soeren Zorn, Frank Drewnick, Tim Bates, Lelia Hawkins, Lynn Russell, Sasha Smirnov, Colin O’Dowd, Andy Hind 17 Aircraft Campaigns: Hugh Coe, Jose Jimenez, Rodney Weber, Ann Middlebrook, RoyaBahreini, Lynn Russell, Matthew Jolleys, May Fu, James Allan, Keith Bower, Gerard Capes, Jonathan Crosier, Will Morgan, Niall Robinson, Paul Williams, Mike Cubison, Pete DeCarlo, Ed Dunlea and MISR, MODIS & CALIOP retrieval teams